
Falling Wedge Breakout Propels Bitcoin Price Above Key Resistance at $9.2K
Latest NewsPublishedMay 28, 2020
Bitcoin price closed the CME gap and made a decisive move above the $9K and $9.2K resistance as traders attempt to carve a new path to $10K.

Within the past few hours Bitcoin (BTC) price managed to press through the $9,200 resistance level to $9,281. While the 2.58% gain may not be much to talk about, the move above the key resistance level is a step forward and the initial move to $9,180 closed the CME gap from last weekend.
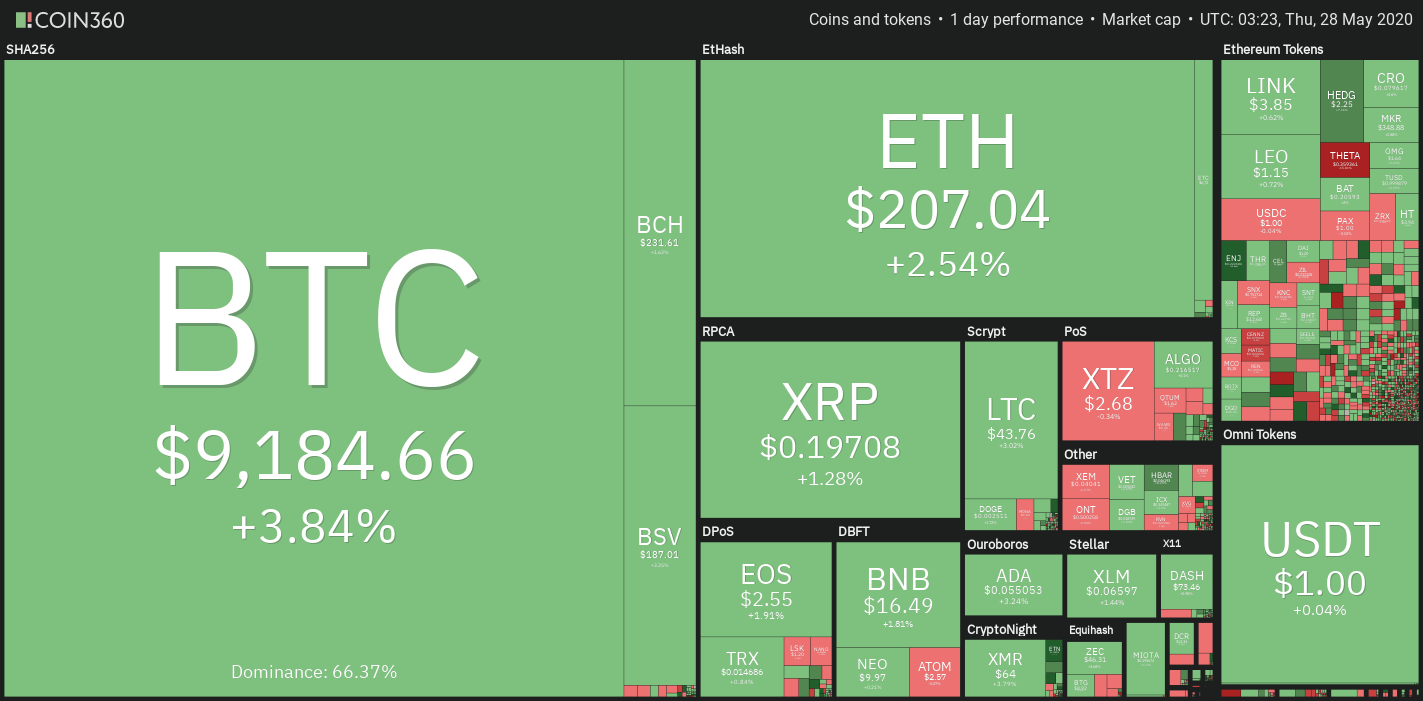
Crypto market weekly price chart. Source: Coin360
Since dropping to $8,640 on May 25, Bitcoin price has gained 7% and this occurred as the S&P 500 and Dow both rallied higher this week.
On Wednesday both indexes broke above their 200-day moving average, nearly reclaiming all of the losses caused by the coronavirus-driven correction that started in March.
The sharp rallies in both markets also led analysts to suggest that the Dow is now “on track for its best week since the week ended April 8.”
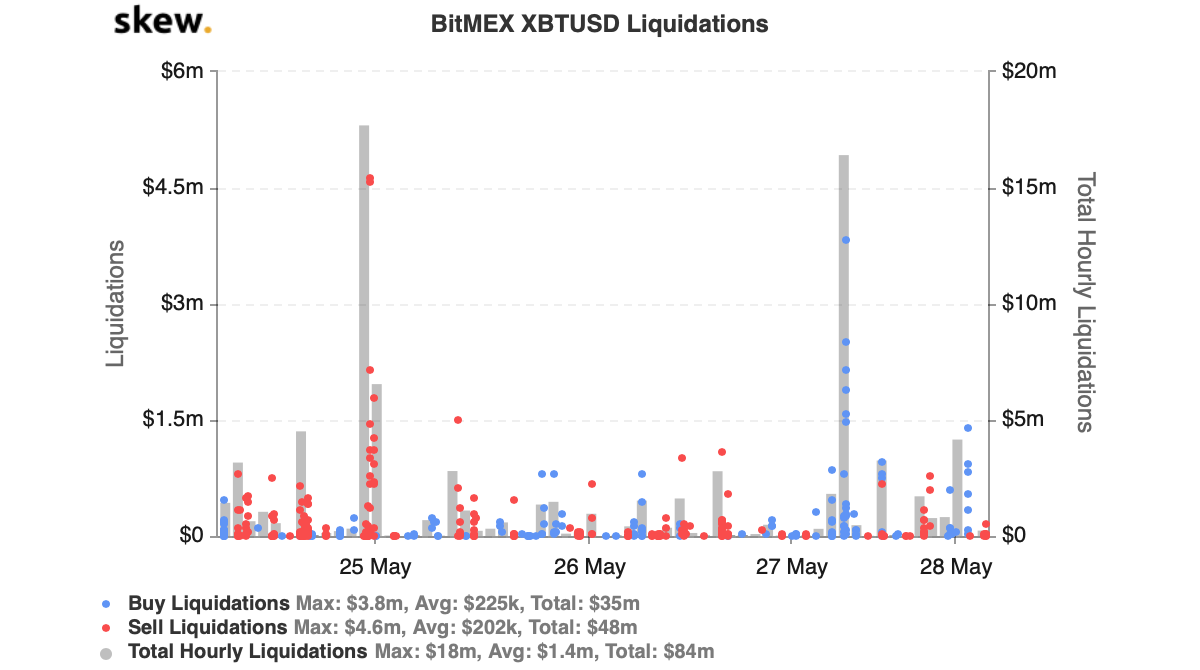
BitMEX XBTUSD Liquidations. Source: TradingView
Data from Skew shows that as Bitcoin reclaimed $9,000 earlier in the day on May 27 approximately $18 million in XBT-USD short positions were liquidated.
Traders will be closely watching to see if the top-ranked digital asset on CoinMarketCap can secure a daily close above the $9,200 level.
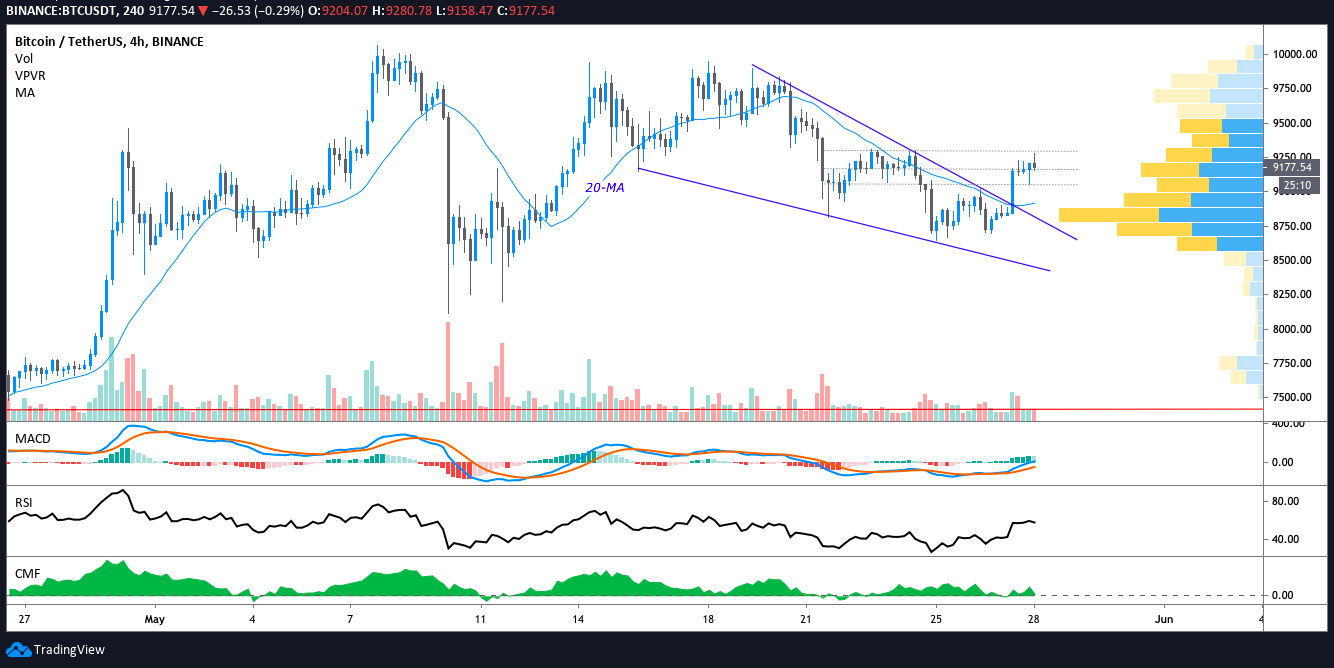
Bitcoin 4-hour price chart. Source: Coin360
As shown by the 4-hour chart, Bitcoin price surged through the falling wedge pattern and in the short-term the price may pull back to retest $9,150 and recent resistance in the $9,000 to $8,800 range. After this bulls will be ready to take aim at $9,350, then $9,500.
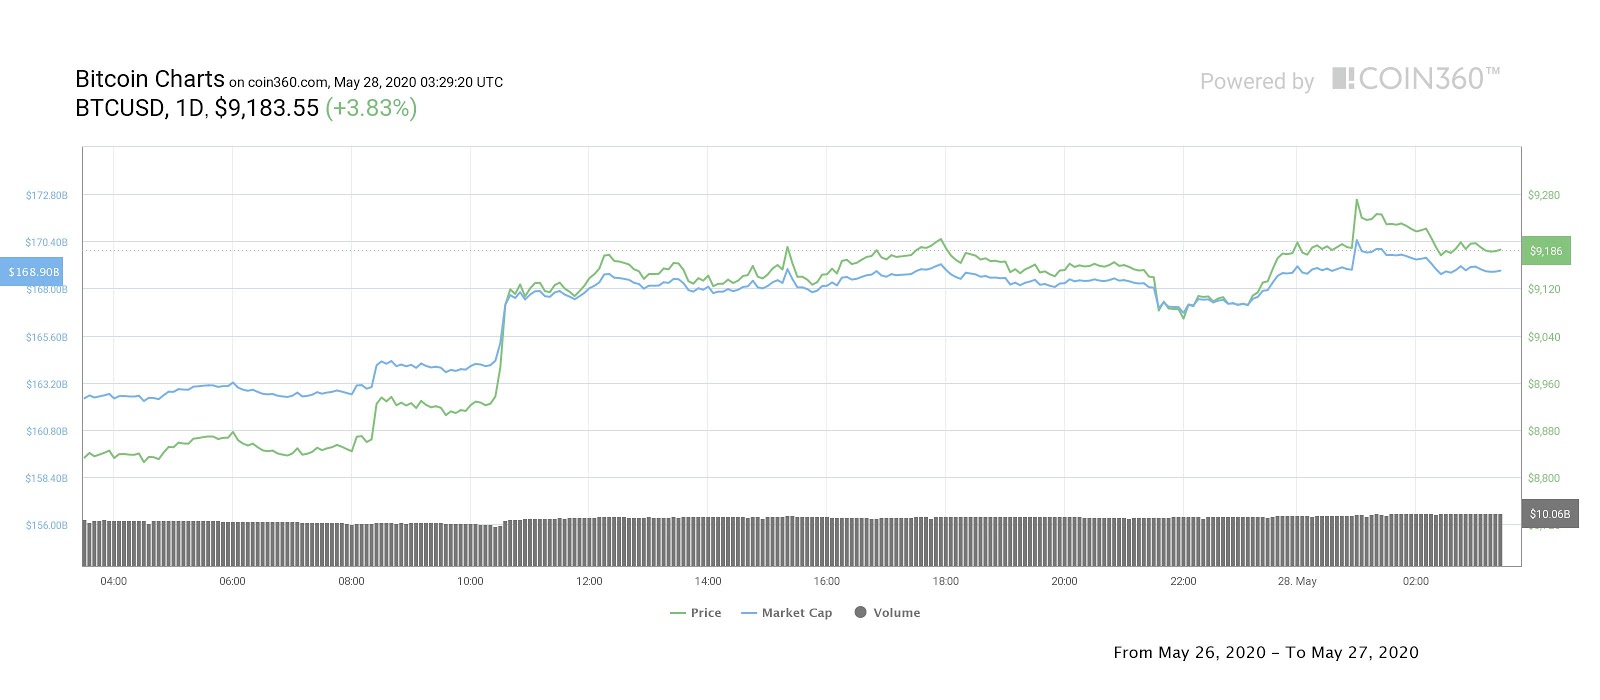
Bitcoin daily price chart. Source: Coin360
Altcoins also managed to post moderate 1-3 percent gains as Bitcoin price pushed through it’s key resistance level. Ether (ETH) rallied 2.57%, Bitcoin Cash (BCH) gained 2.37%, and Cardano (ADA) added 3.51%.
According to CoinMarketCap, the overall cryptocurrency market cap now stands at $256.4 billion and Bitcoin’s dominance rate is 65.9%.
Keep track of top crypto markets in real time here


Subscribe to daily byte-sized crypto news from Cointelegraph
Cointelegraph is committed to independent, transparent journalism. This news article is produced in accordance with Cointelegraph’s Editorial Policy and aims to provide accurate and timely information. Readers are encouraged to verify information independently.
More on the subject