
Is Ethereum safe above $2K? Traders are watching these ETH price levels
MarketsPublishedApr 28, 2026
Ethereum market participants saw the 100-day SMA at $2,200 as particularly important for bulls to hold to avoid a deeper correction.

Ether (ETH) analysts have mapped out key ETH price levels to watch over the next few weeks, with a focus on the $2,000 psychological level.
Key takeaways:
- Dropping below the 200-day simple moving average at $2,220 could confirm more downside for Ether.
- ETH faces stiff resistance at $2,400, a level that must be reclaimed by the bulls.
Ether price stuck between two key levels
Data from TradingView showed the ETH/USD pair trading below $2,300, down 5% over the last two days and erasing all gains made over the weekend.
This meant that the price remained wedged between the 100-day exponential moving average at $2,350 and the 100-day simple moving average (SMA) at $2,220, as shown in the chart below.
This suggested that Ether could consolidate within these trend lines for a few more days before a decisive move.
Telegram trading resource Technical Crypto Analyst said that after losing the support trendline at $2,300, “we can probably expect Ethereum to drop, and it might even hit the lower support level in the next few days,” adding:
“A solid breakdown with good volume would confirm this.”
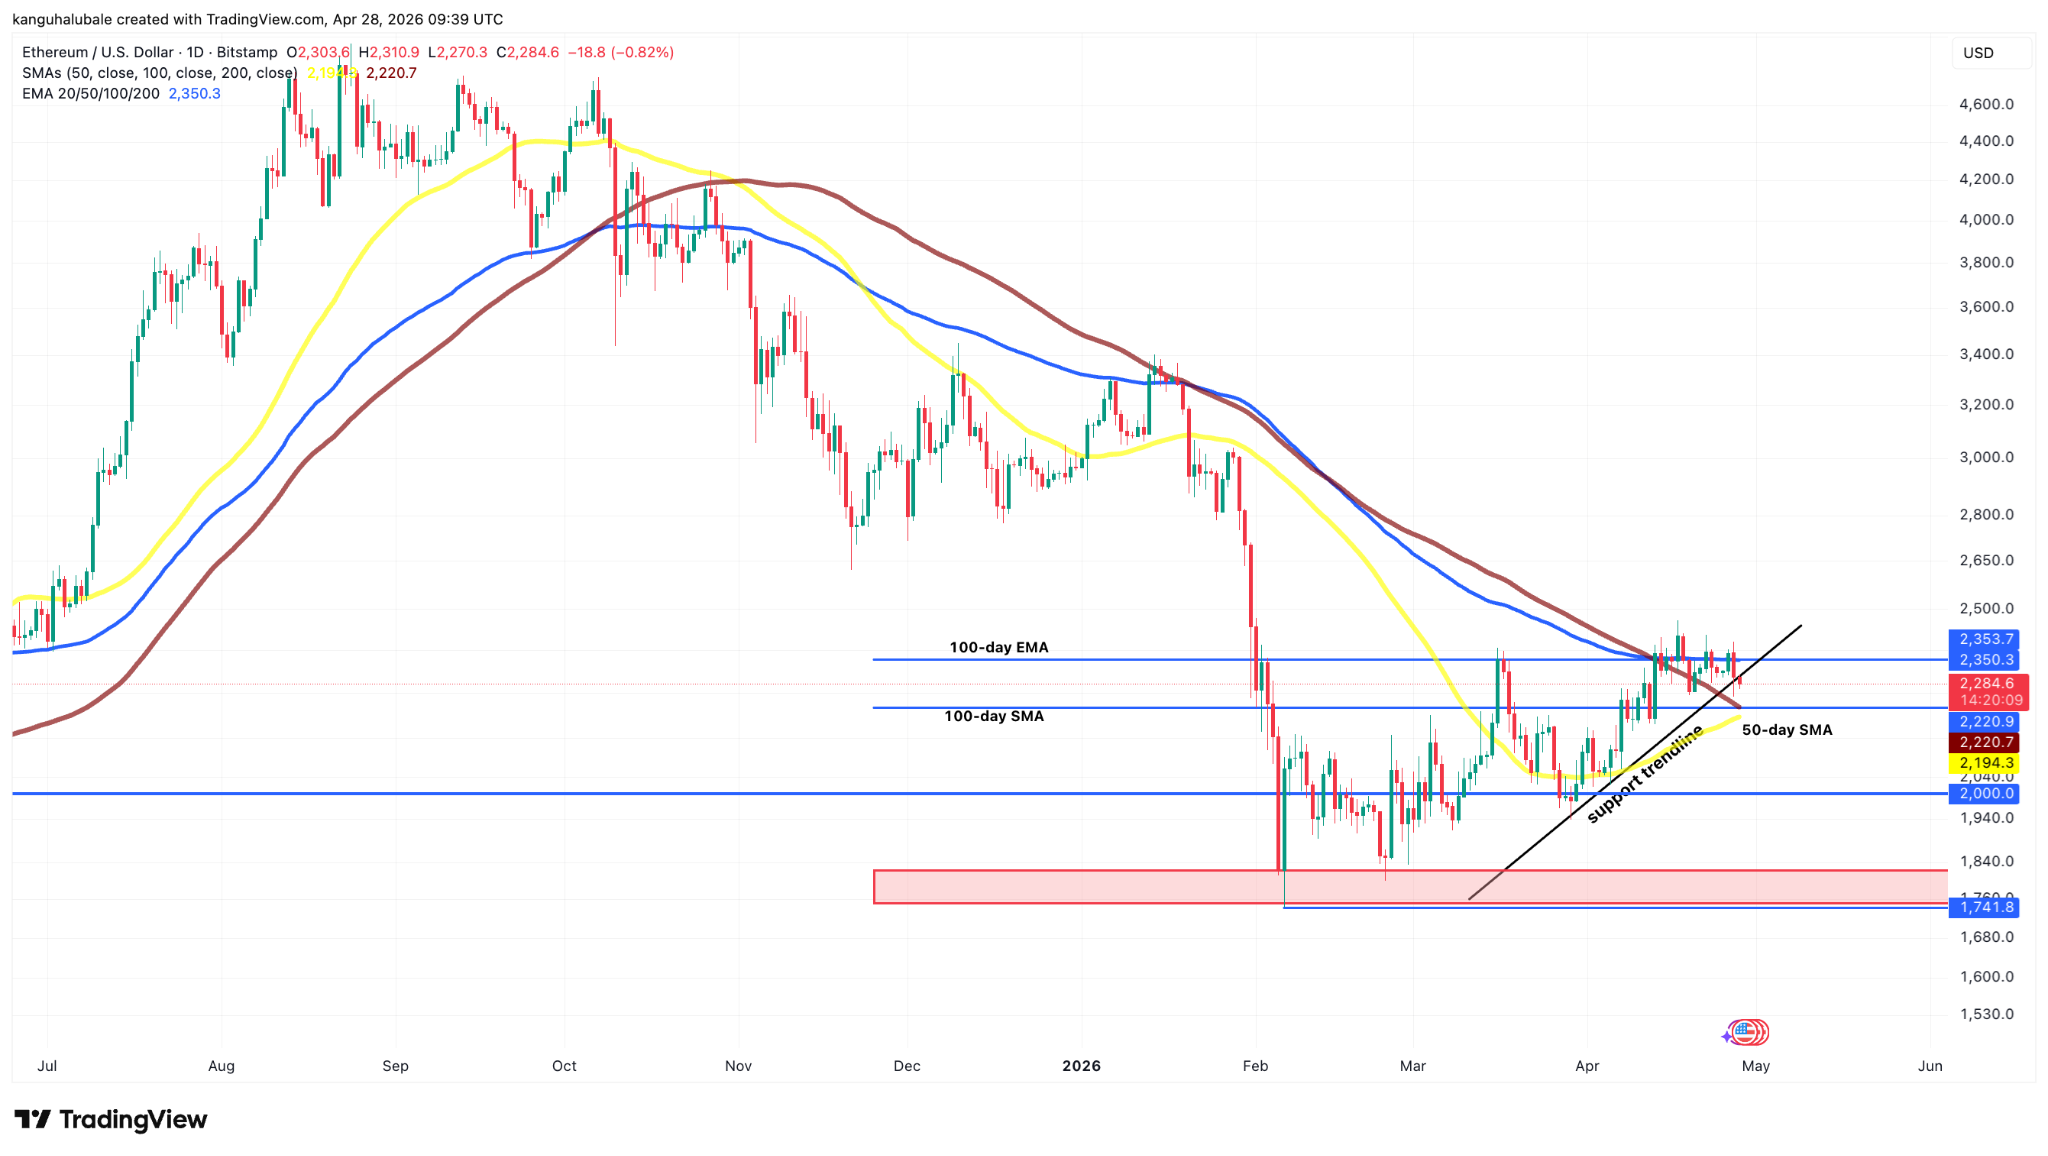
ETH/USD daily chart. Source: Cointelegraph/TradingView
The analyst was referring to two immediate support zones: the $2,200 area, where the 50-day and 100-day SMAs converge, and the psychological level at $2,000.
“ETH has dropped below the $2,300 level,” said fellow analyst Ted Pillows in a Tuesday post on X, adding:
“The next crucial support zone is $2,200 which could be a level for a short-term bounceback.”
A key buy zone to watch below that is the $1,800-$1,750 area, which aligns with the multi-year low reached on Feb. 6.
In a recent post on X, trader Daan Crypto Trades said that the key levels to watch were $2,100 as support and the resistance at $2,800, which ETH price has “respected” well over the past few years.
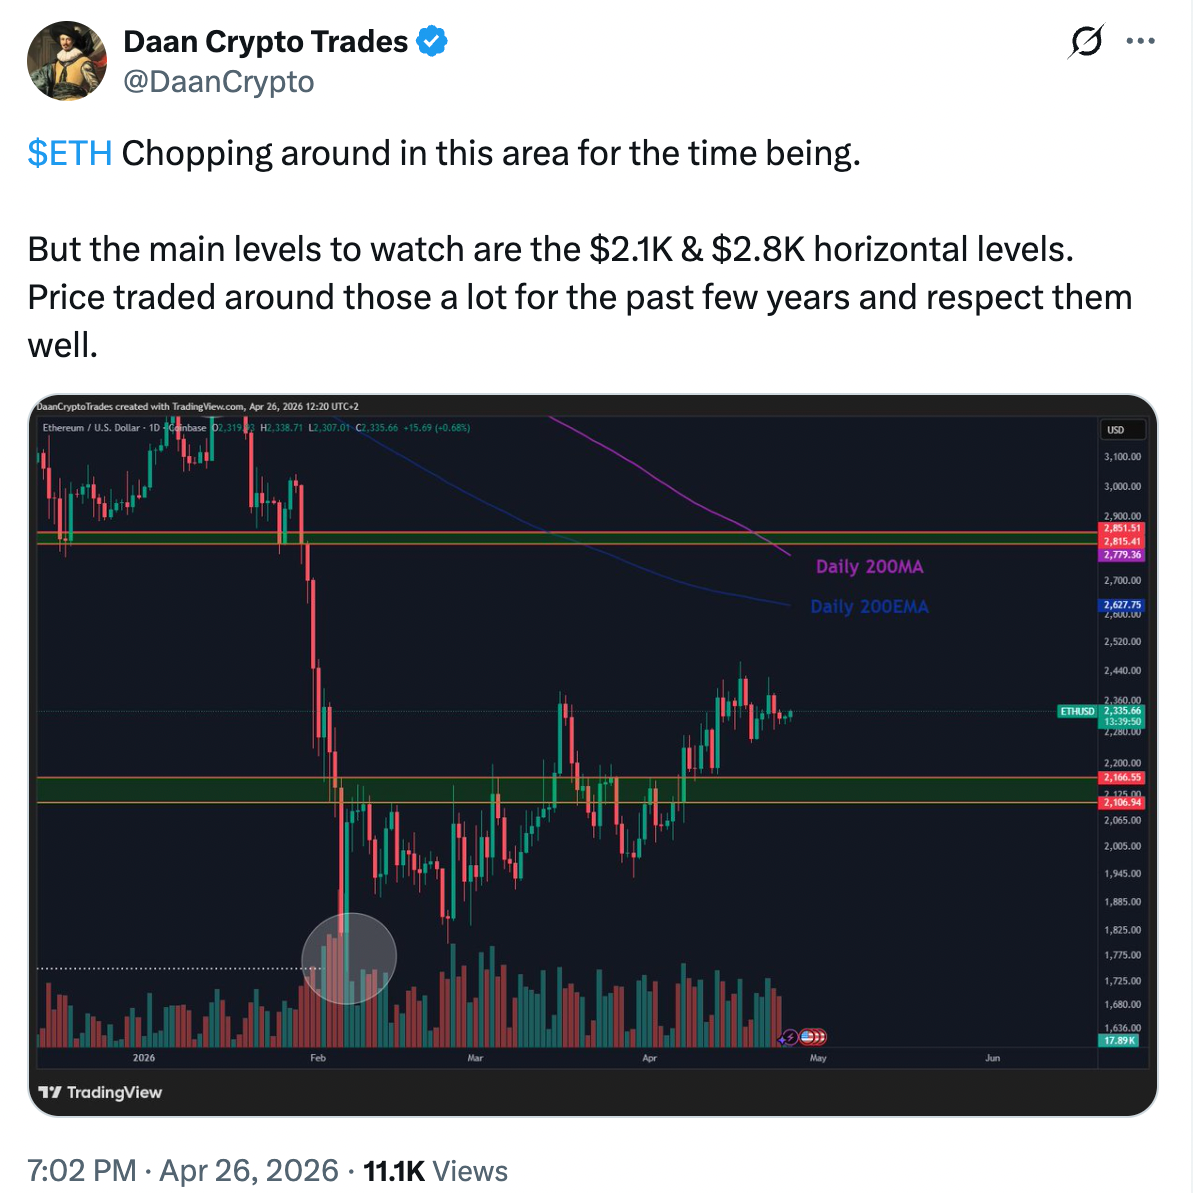
ETH/USD daily chart. Source: X/Daan Crypto Trades
As Cointelegraph reported, a daily close below the moving averages around $2,200 would bring the next line of defense at $2,000 into focus.
Ethereum price must reclaim $2,400 to continue recovery
As Cointelegraph also reported, Ether’s bullish case hinges on flipping the resistance at $2,400 into support, where the realized price currently is.
“This is a very important psychological factor,” CryptoQuant analyst CW8900 said in a recent X post, adding:
“Breaking through that line signifies that whales are transitioning to a profitable position.”
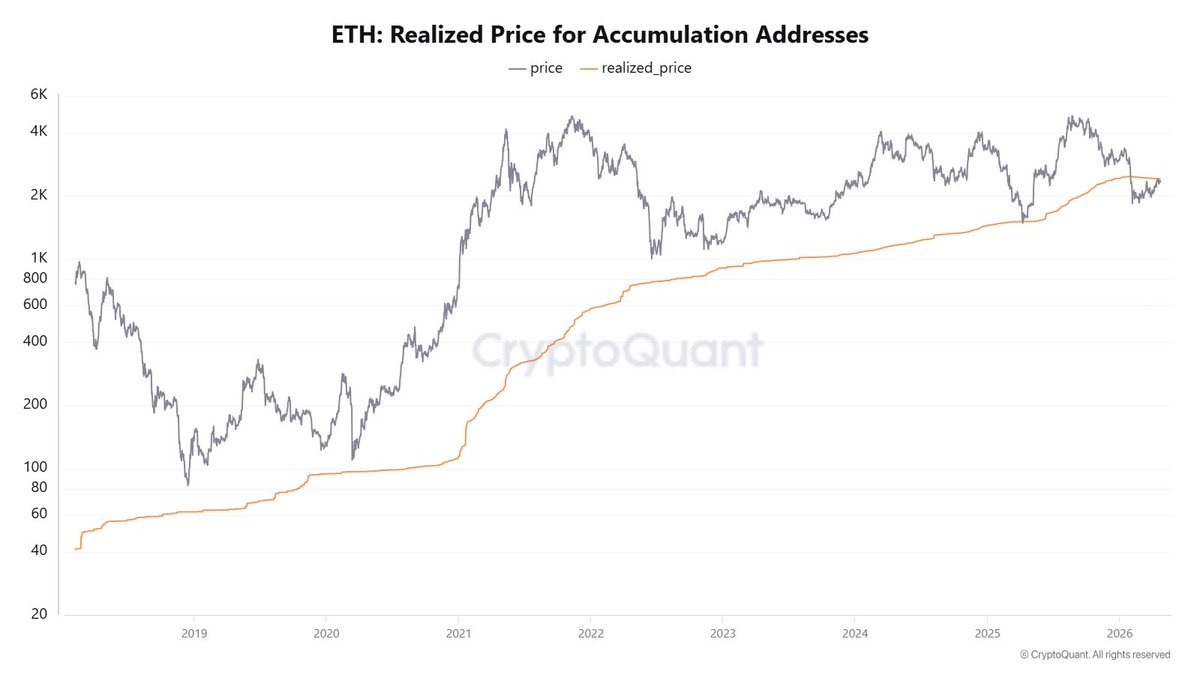
ETH realized price. Source: CryptoQuant
With whales back in a profitable position, it would “provide grounds for their buying power to become stronger,” the analyst added.
Related: Ethereum’s EEZ could pull other blockchains into its orbit
Meanwhile, Ether’s liquidation map reveals that a break above $2,400 would trigger over $1.94 billion in short liquidations across all exchanges.
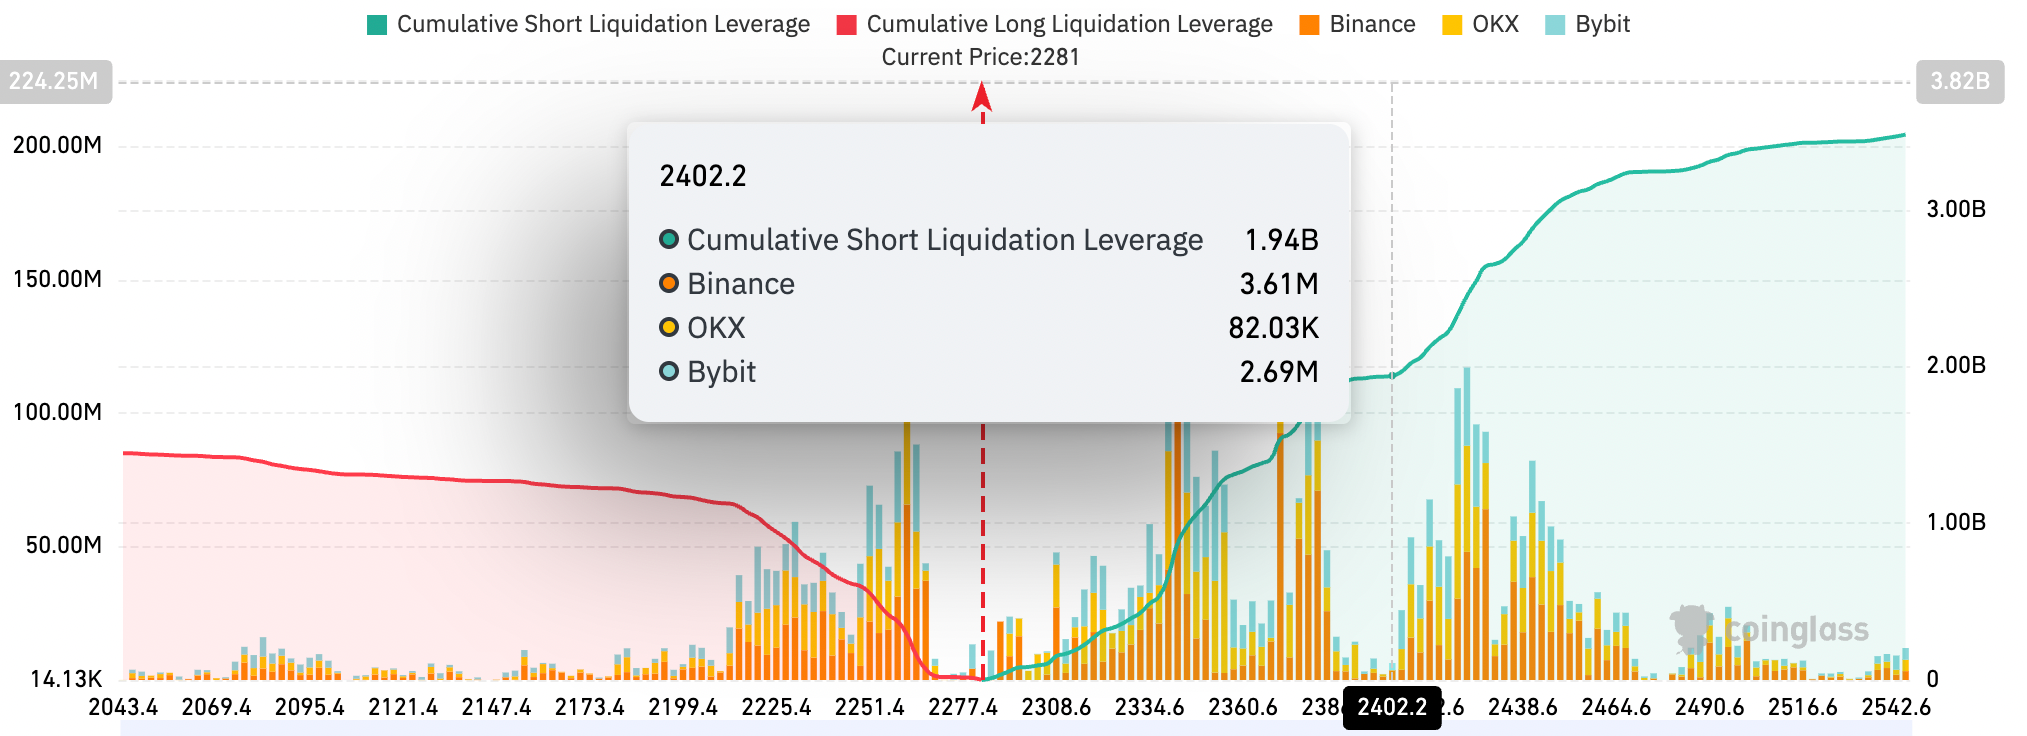
This means a significant amount of bearish bets risk liquidation on a move higher, opening the way to a sharper upward cascade if the recovery resumes.

Subscribe to daily byte-sized crypto news from Cointelegraph
This article is produced in accordance with Cointelegraph's Editorial Policy and is intended for informational purposes only. It does not constitute investment advice or recommendations. All investments and trades carry risk; readers are encouraged to conduct independent research.
More on the subject