


 Written by Rakesh Upadhyaystaff writerEdited by Ray Salmondstaff editor
Price predictions 5/25: SPX, DXY, BTC, ETH, XRP, BNB, SOL, DOGE, HYPE, ZEC
MarketsPublishedMay 25, 2026
Bitcoin’s weekend bounce shows strong demand at lower levels, but holding $78,000 may remain a challenge for the bulls.

Key points:
- Bitcoin needs to cross and maintain above $78,000 to start a stronger recovery toward $84,000.
- HYPE and ZEC remain strong while other major altcoins struggle to rise above their overhead resistance levels.
Bitcoin (BTC) bounced on Saturday following US President Donald Trump’s announcement in a post on his Truth Social platform that negotiations between the US and Iran were “proceeding in an orderly and constructive manner.” Buyers extended the recovery on Monday and are attempting to sustain above $77,500.
The uncertainty of the past few days has resulted in $1.55 billion in net outflows from the US BTC exchange-traded funds. Crypto sentiment platform Santiment said in a report on Friday that sharp outflows from BTC ETFs indicate retail capitulation, which has “historically correlated with conditions favorable for patient accumulation” for long-term holders rather than panic.
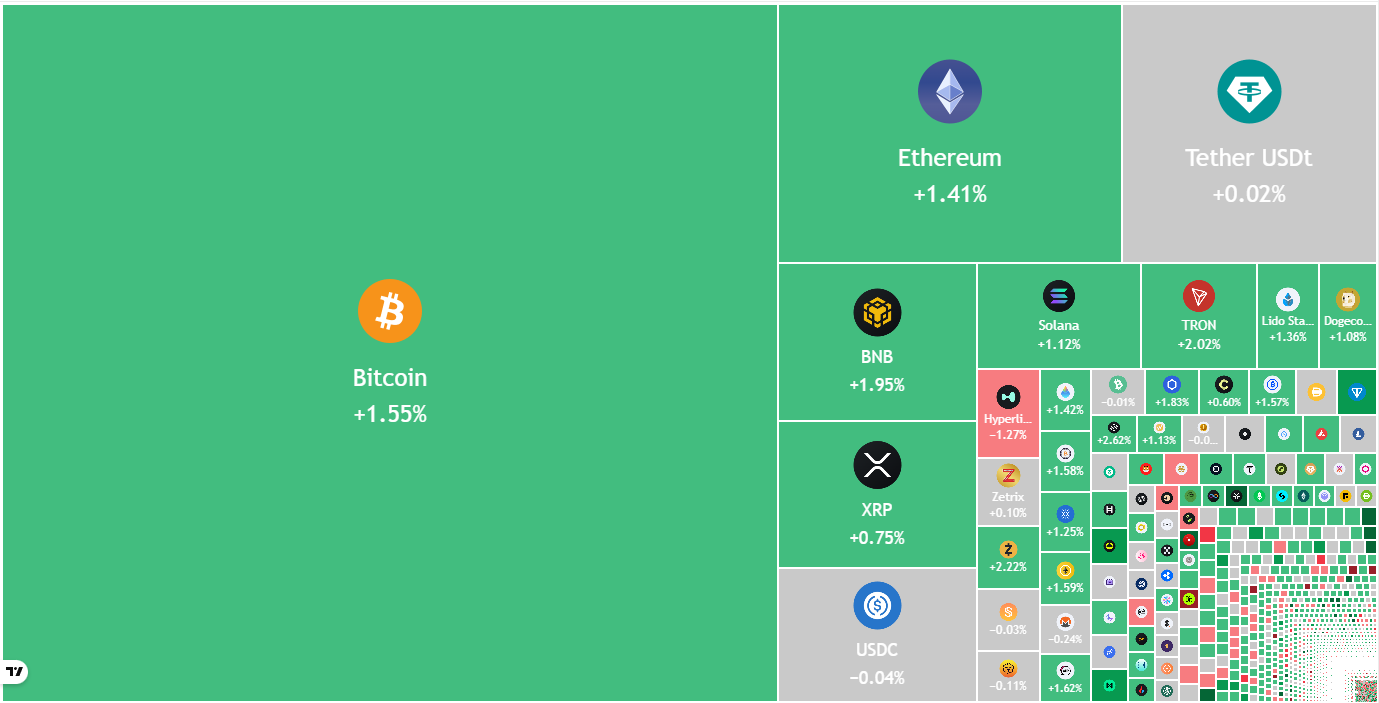
Crypto market data daily view. Source: TradingView
CryptoQuant analyst Darkfost said in a post on X that BTC’s apparent demand has dropped to about -147,000 BTC, the most bearish since December 2025. That suggests a sustainable rally would be difficult without the support of genuine spot demand. However, the analyst added that the current environment creates “interesting opportunities for long-term investors capable of remaining patient.”
Could BTC and the major altcoins break above their overhead resistance levels? Let’s analyze the charts of the top 10 cryptocurrencies to find out.
S&P 500 Index price prediction
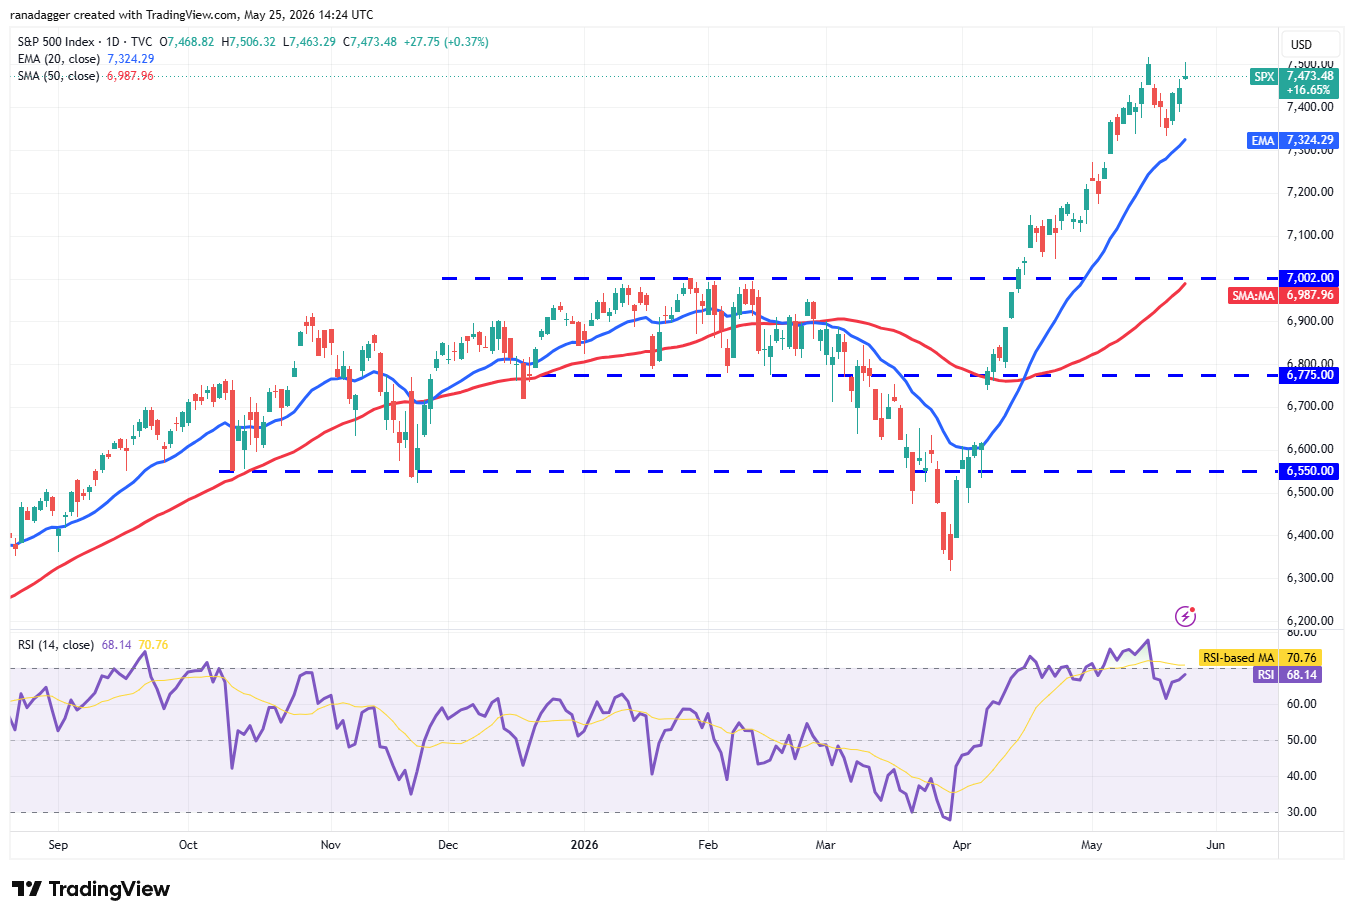
The S&P 500 Index (SPX) rallied toward the all-time high of 7,517 on Friday, indicating that buyers remain in command.
SPX daily chart. Source: Cointelegraph/TradingView
If the price rises and maintains above 7,500, the index may start the next leg of the uptrend toward the 8,000 level.
The first sign of weakness will be a break and close below the 20-day exponential moving average (7,324). Such a move suggests that the short-term traders are booking profits. That may start a deeper correction to 7,180 and then the breakout level of 7,002. Until then, all dips are likely to be viewed as a buying opportunity.
US Dollar Index price prediction
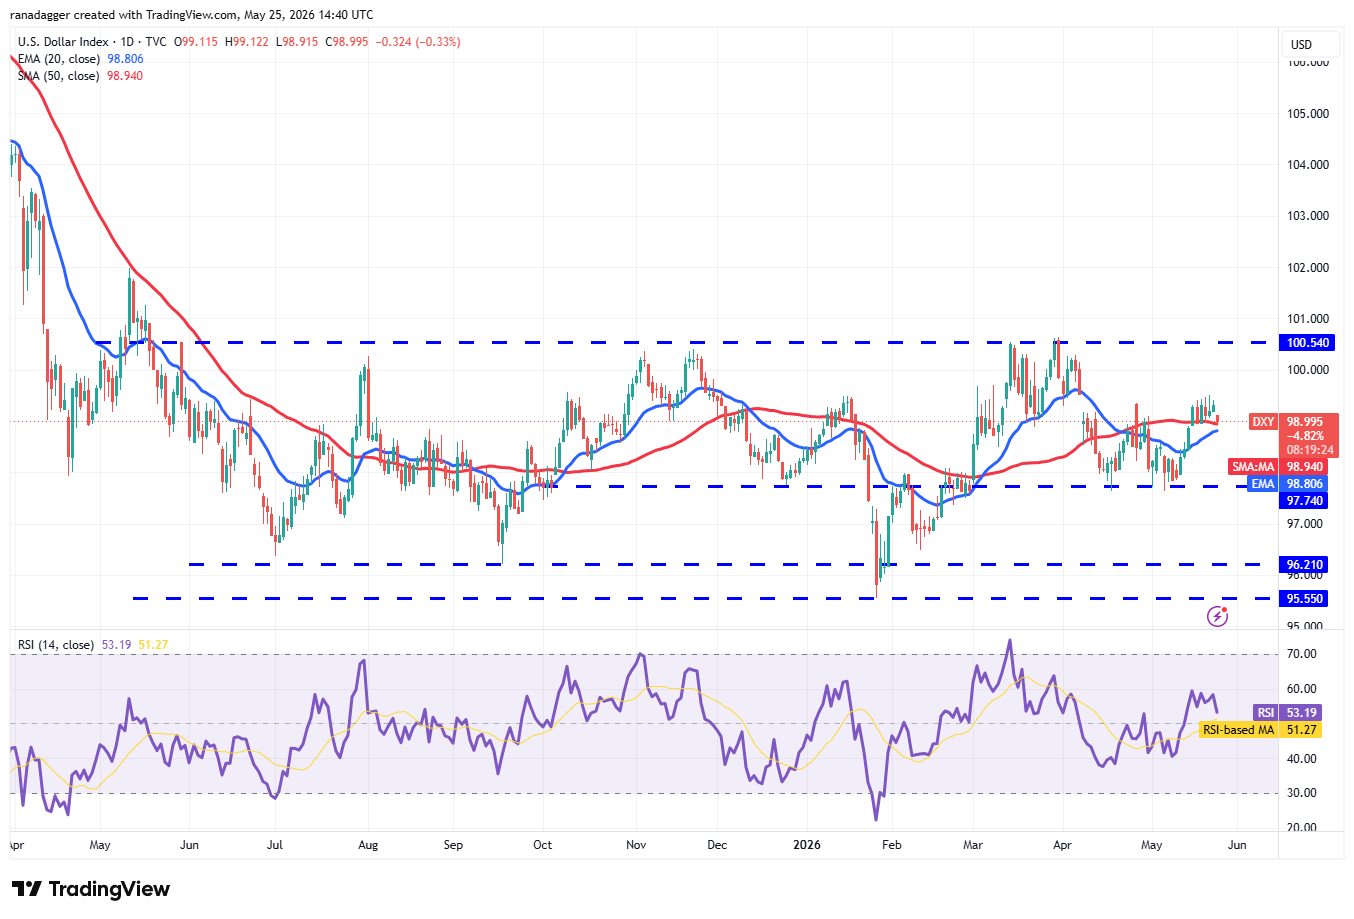
The US Dollar Index (DXY) turned down from 99.51 on Thursday, indicating that the sellers are active at higher levels.
DXY daily chart. Source: Cointelegraph/TradingView
The 20-day EMA (98.80) is expected to act as a strong support on the way down. If the price rebounds off the 20-day EMA with strength, it increases the likelihood of a rally above the 99.51 level. The index may then climb to the stiff overhead resistance at 100.54. Buyers will have to pierce the 100.54 level to signal the start of a new up move.
Sellers are likely to have other plans. They will attempt to pull the price below the 20-day EMA, opening the door to a drop toward the 97.74 support.
Bitcoin price prediction
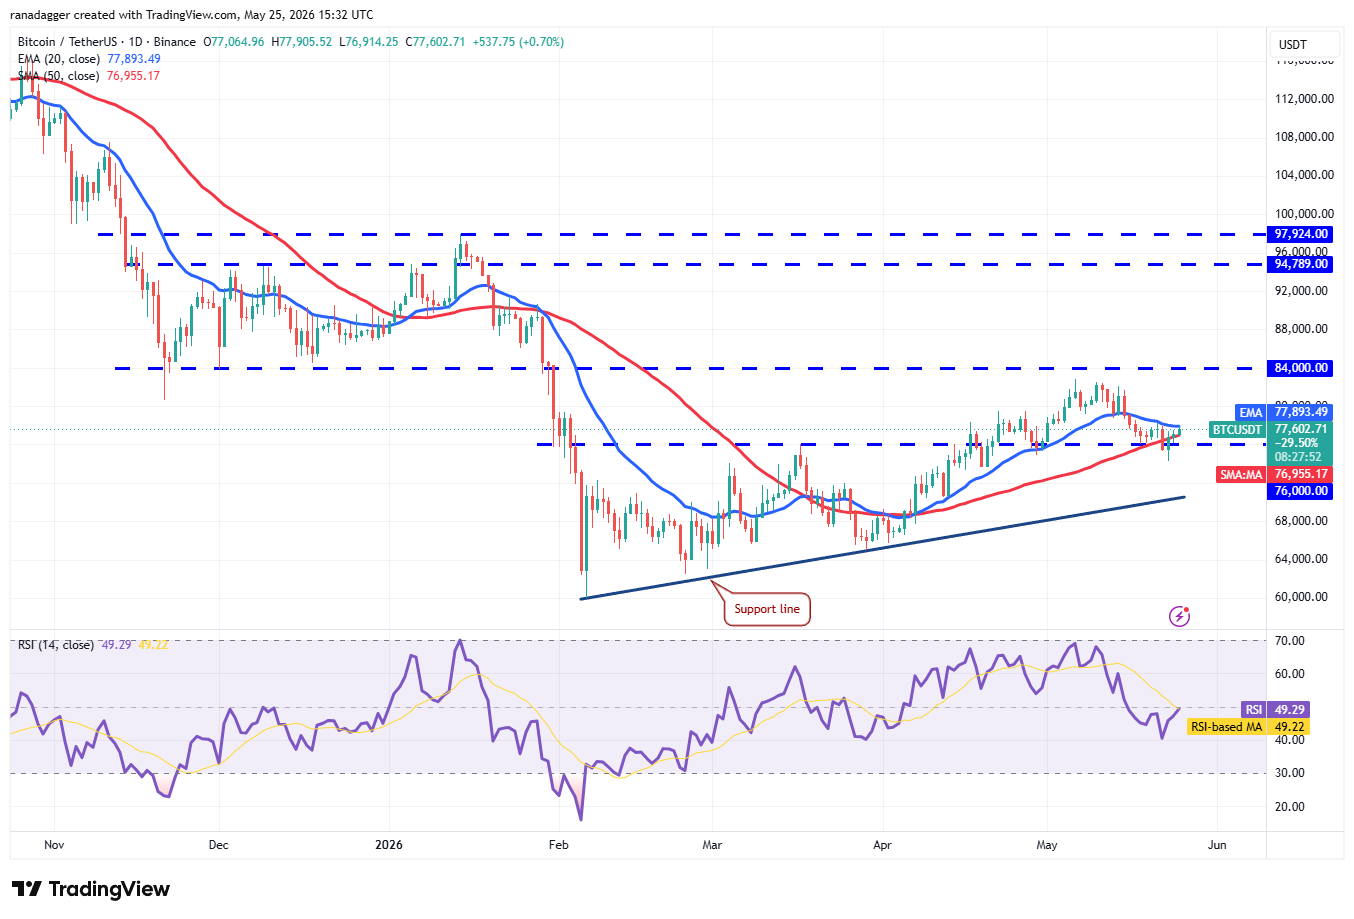
BTC closed below the $76,000 support level on Friday, but the bulls bought the dip and reclaimed it on Saturday. That shows demand at lower levels.
BTC/USDT daily chart. Source: Cointelegraph/TradingView
Sellers are attempting to stall the relief rally at the 20-day EMA ($77,893), but the bulls continue to exert pressure. If buyers propel the price above the 20-day EMA, the BTC/USDT pair may climb to $80,000 and eventually to $84,000.
Contrary to this assumption, if the BTC price declines and breaks below $74,289, it suggests the bears are attempting to take charge. The pair may then slide toward the support line, which is likely to attract buyers.
Ether price prediction
Buyers are attempting to push Ether (ETH) back into the ascending channel pattern, but the bears have held their ground.
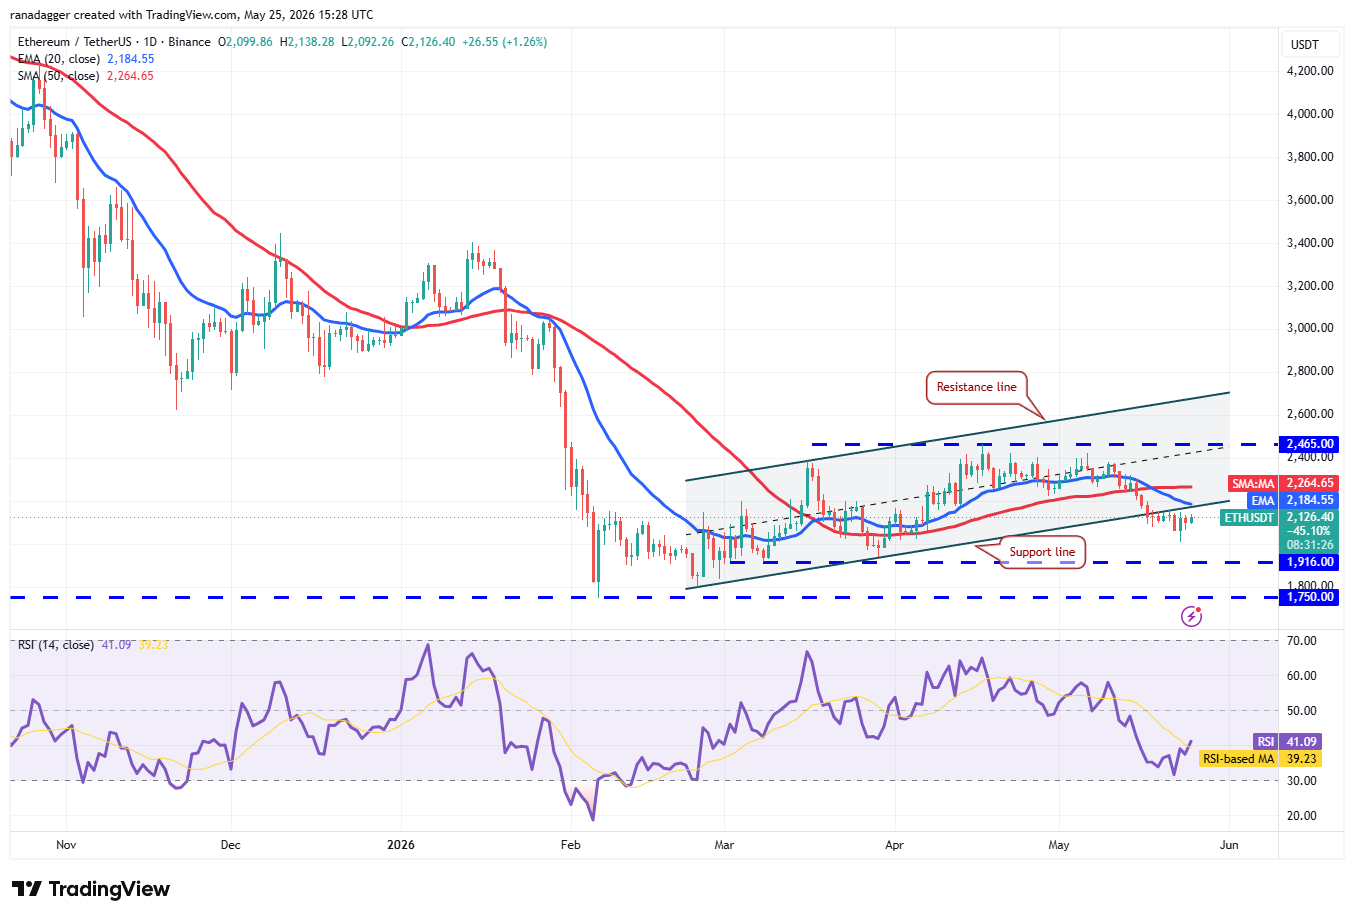
ETH/USDT daily chart. Source: Cointelegraph/TradingView
The downsloping 20-day EMA ($2,184) and the relative strength index (RSI) in the negative zone indicate a slight edge to the bears. If the price drops below the 20-day EMA, the ETH/USDT pair may dip to the psychological level of $2,000, then to $1,916.
This negative view will be invalidated in the near term if the bulls push ETH price above the moving averages and hold. If that happens, it suggests that the market rejected the break below the support line. The pair may then ascend to the $2,465 resistance.
XRP price prediction
XRP (XRP) continues to trade below the moving averages, indicating that the bears remain in control.
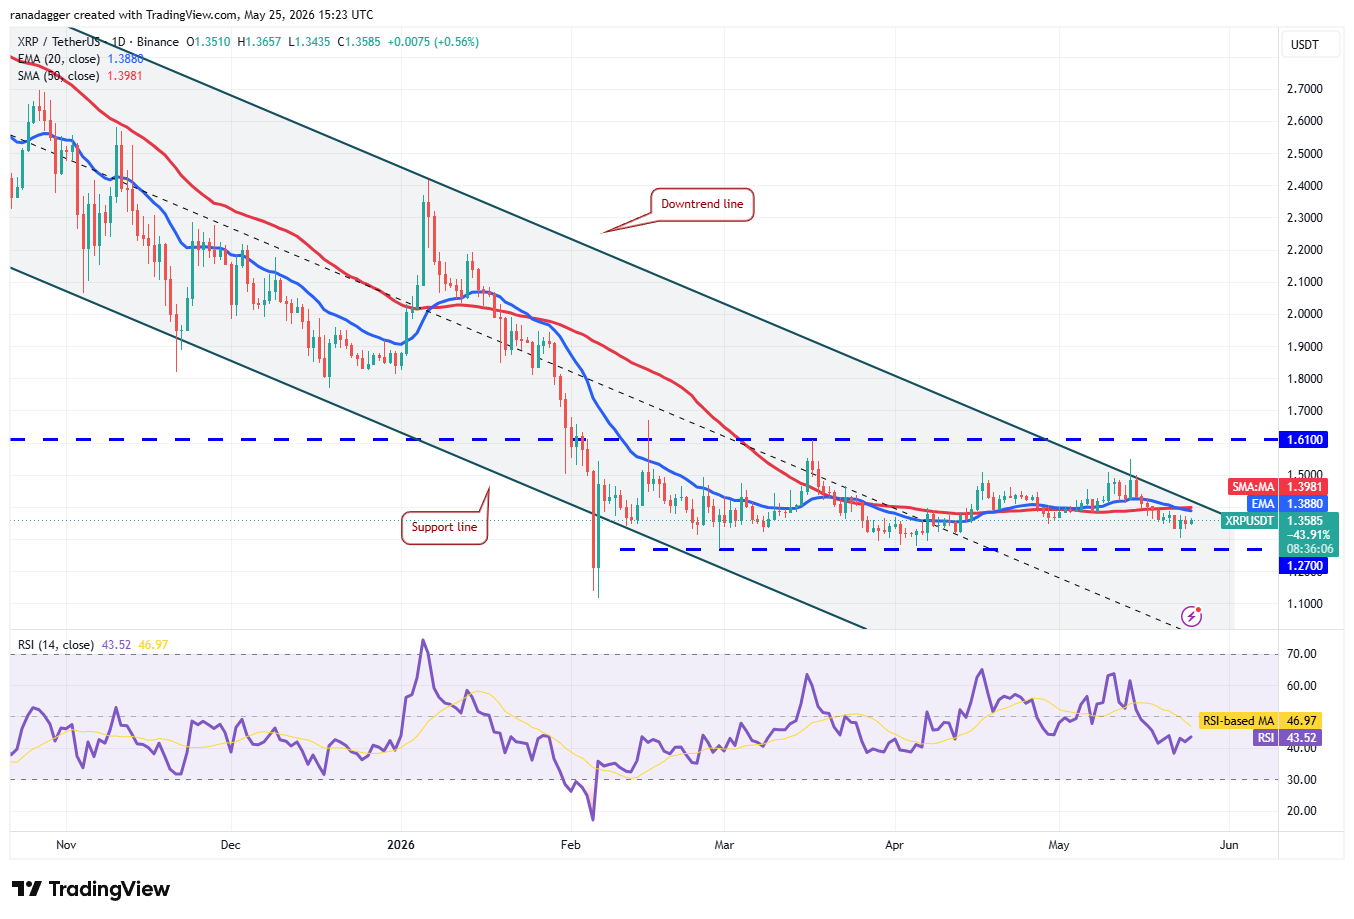
XRP/USDT daily chart. Source: Cointelegraph/TradingView
Sellers will attempt to strengthen their position by pushing the XRP price below the $1.27 support level. If they manage to do that, the XRP/USDT pair may plummet to $1.11, then to the psychological support level at $1.
Buyers will have to achieve a close above the downtrend line of the descending channel pattern to signal a comeback. If they do that, the pair may rise to the $1.61 overhead resistance. A close above $1.61 signals a potential trend change.
BNB price prediction
BNB (BNB) dipped below the 20-day EMA ($652) on Saturday, but the long tail on the candlestick shows buying near the 50-day SMA ($635).
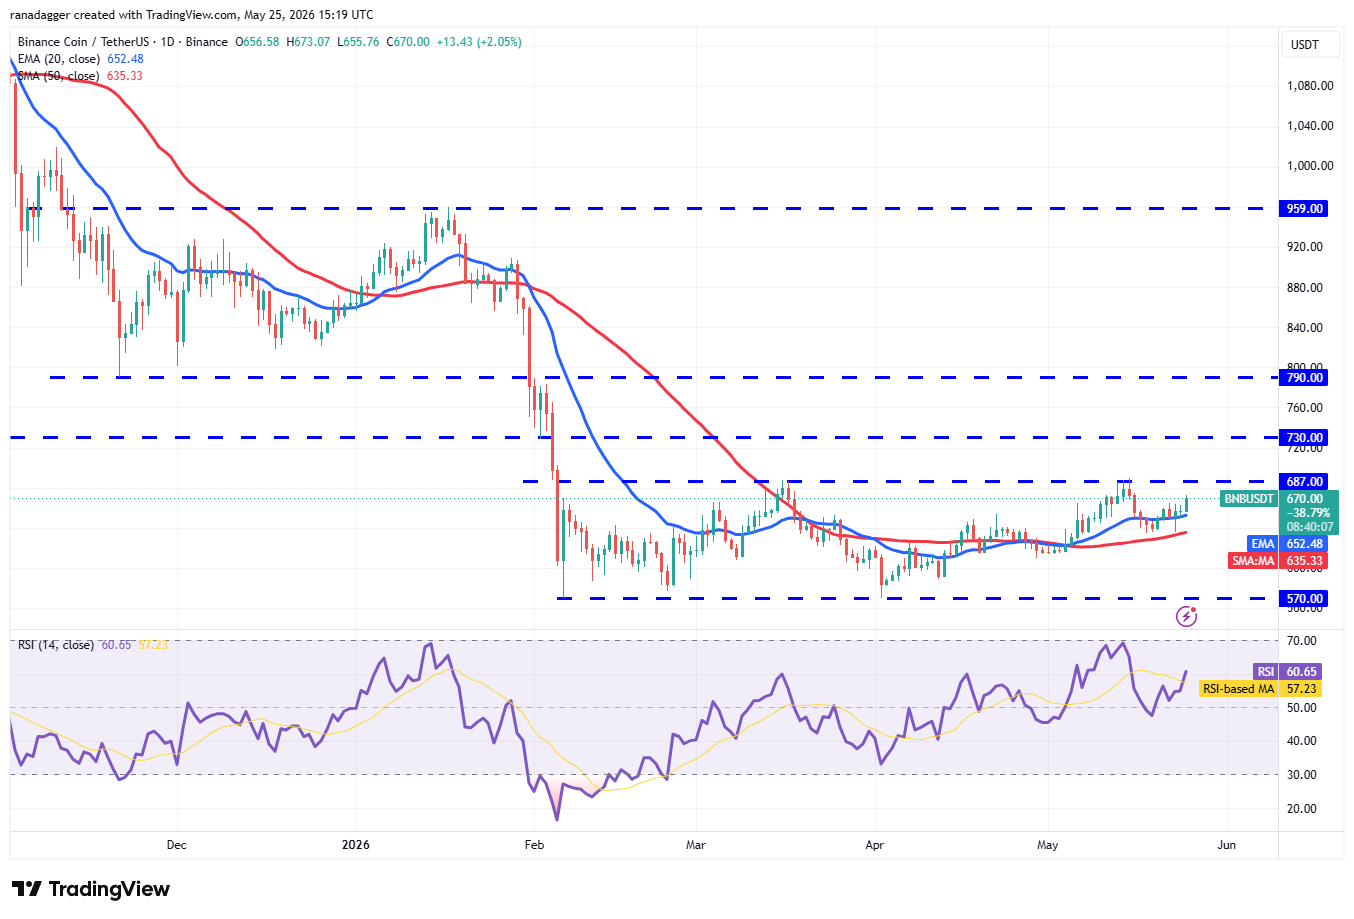
BNB/USDT daily chart. Source: Cointelegraph/TradingView
The flattish 20-day EMA and the RSI just above the midpoint give a slight edge to the bulls. Buyers will have to secure a close above the $687 resistance to signal the start of a new uptrend toward $730, and subsequently toward $790.
Instead, if the BNB price declines from the $687 level and breaks below the 50-day SMA, it suggests the bears have not given up. The BNB/USDT pair may then extend its stay inside the $570 to $687 range for some more time.
Solana price prediction
Solana (SOL) bounced off the $82.65 support on Saturday, but the bulls are struggling to clear the 20-day EMA ($87.12) hurdle.
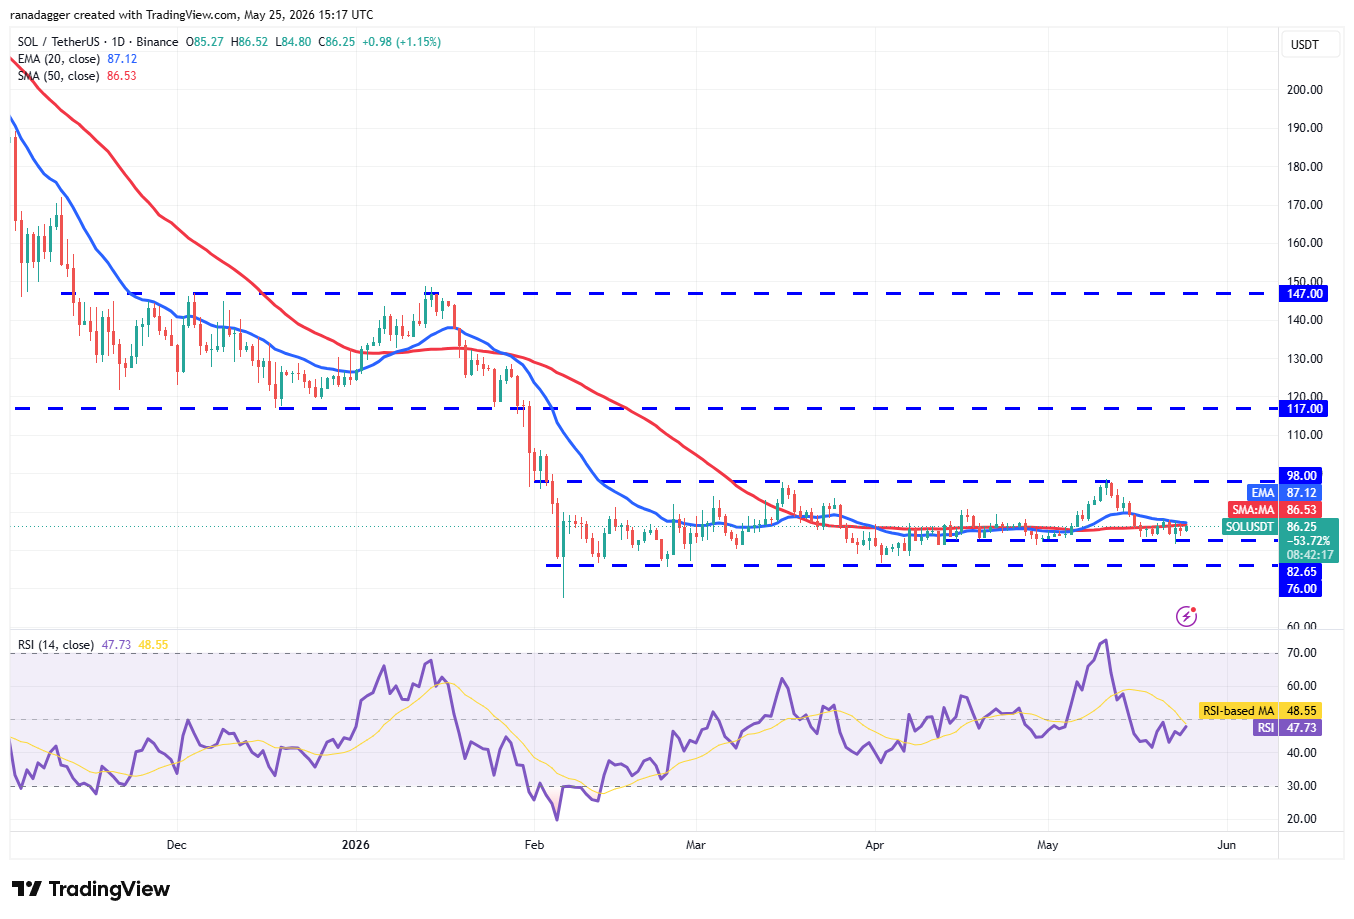
SOL/USDT daily chart. Source: Cointelegraph/TradingView
If the price drops below the 20-day EMA, sellers will again attempt to push the SOL/USDT pair below the $82.65 support. If they can pull it off, the SOL price may plummet to the $76 support. Buyers are expected to aggressively defend the $76 level, as a close below it may sink the pair to $67.
On the upside, a break and close above the 20-day EMA suggests selling pressure is easing. The pair may then attempt a rally to the $98 level, where the bears are expected to mount a strong defense.
Related: XRP price in ‘value zone’ near $1.40 as whales pull $170M from exchanges
Dogecoin price prediction
Buyers are attempting to maintain Dogecoin (DOGE) above the 50-day SMA ($0.10), but the bears have kept up the pressure.
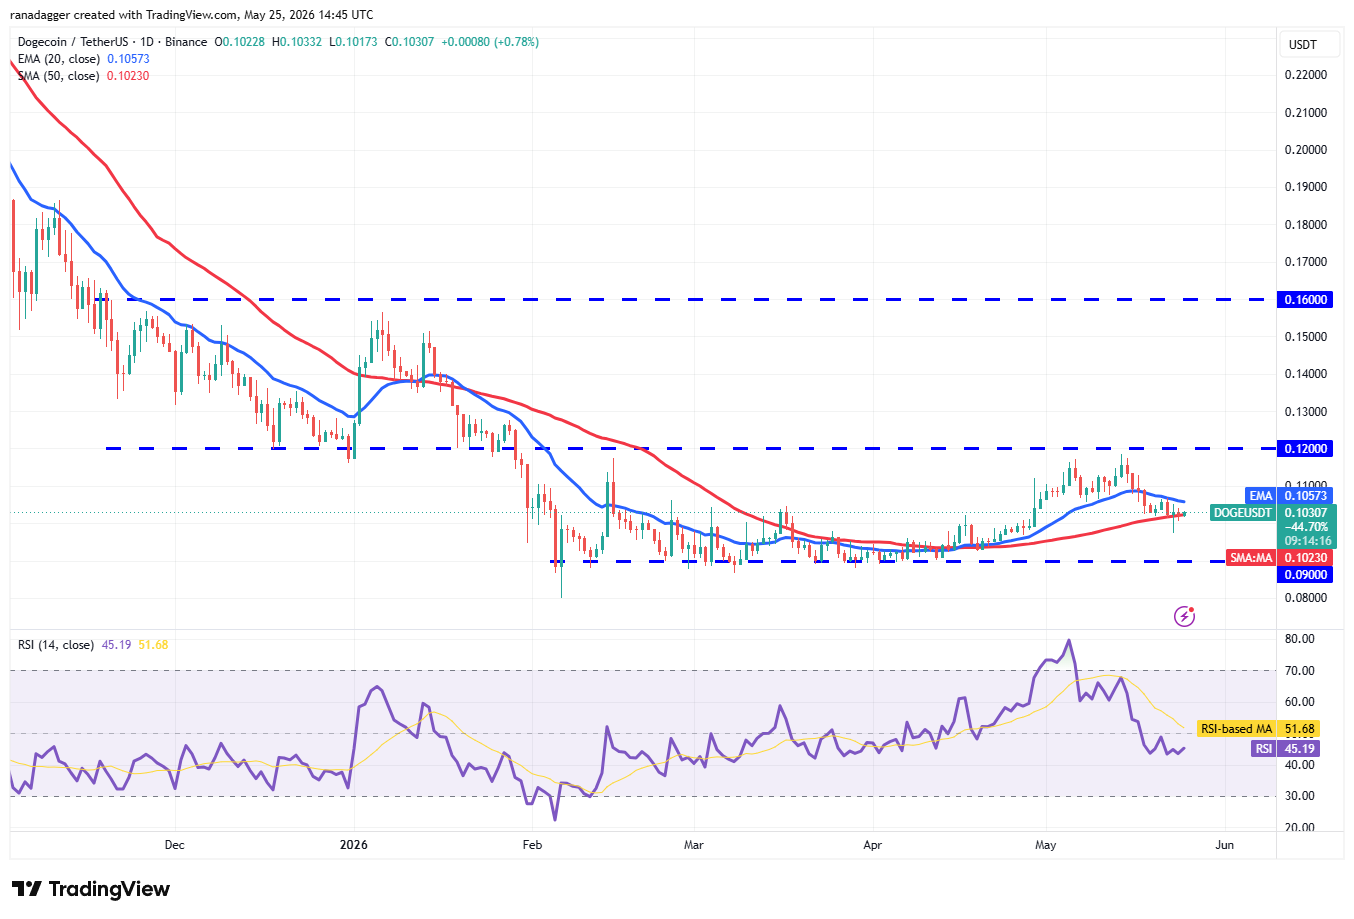
DOGE/USDT daily chart. Source: Cointelegraph/TradingView
The downsloping 20-day EMA ($0.10) and the RSI in the negative territory indicate an advantage to bears. A close below the 50-day SMA clears the path for a drop to the $0.09 level. Buyers will attempt to keep the DOGE price within the $0.09 to $0.12 range by defending the support level.
Alternatively, a close above the 20-day EMA signals buying at lower levels. The DOGE/USDT pair may then rally to the $0.12 resistance. A close above the $0.12 level clears the path for a new up move.
Hyperliquid price prediction
Hyperliquid (HYPE) rallied to a new all-time high of $64.72 on Sunday, indicating that the bulls remain in control.
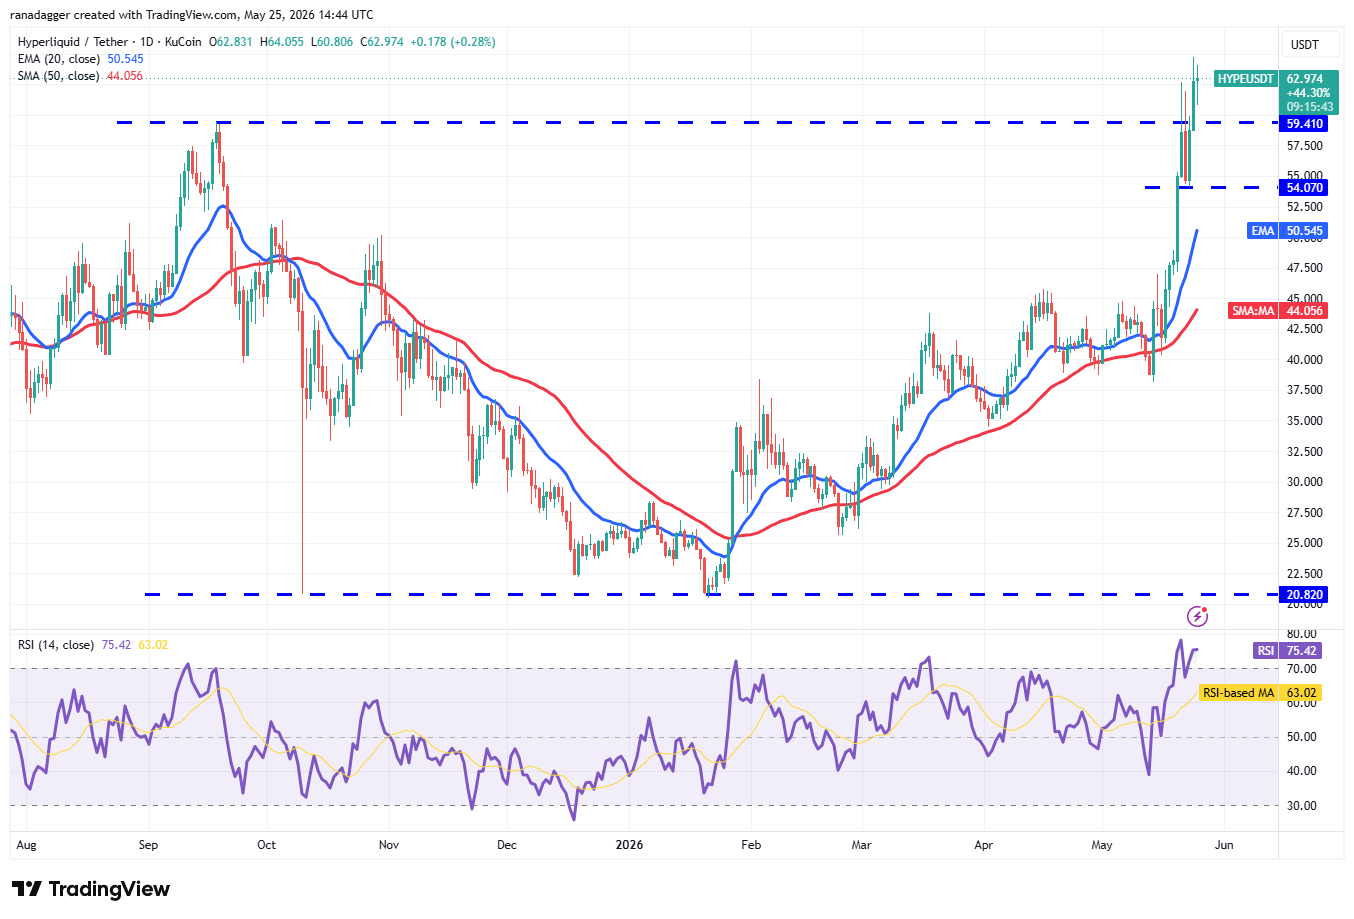
HYPE/USDT daily chart. Source: Cointelegraph/TradingView
The HYPE/USDT pair pulled back on Monday, but the long tail on the candlestick shows that the bulls continue to buy the dips. That increases the possibility of a resumption of the uptrend toward the next target objective at $77.
The first support on the downside is the breakout level at $59.41, followed by $54.07. A break and close below the $54.07 level may start a deeper correction to the 20-day EMA ($50.54) and then the 50-day SMA ($44.05).
Zcash price prediction
Zcash (ZEC) turned up sharply from the 20-day EMA ($572) on Saturday, indicating a positive sentiment.
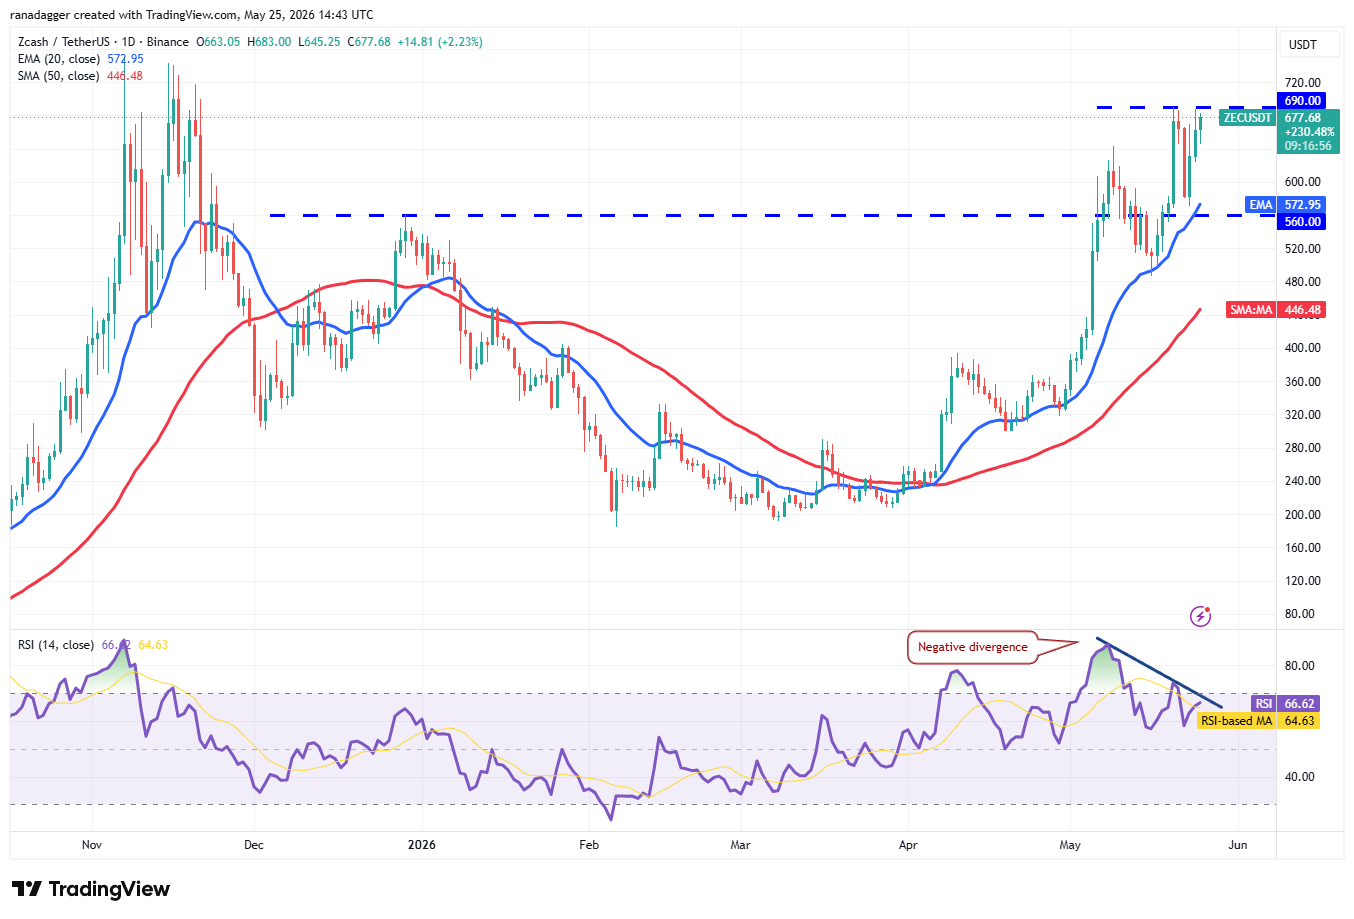
ZEC/USDT daily chart. Source: Cointelegraph/TradingView
A minor negative for the bulls is the developing negative divergence on the RSI. That suggests the bullish momentum may be weakening. Sellers will have to tug the ZEC price below the 20-day EMA to start a deeper correction toward $487.
This negative view will be invalidated in the near term if the ZEC/USDT pair continues higher and closes above $690. That clears the path for a rally to $750, likely to attract aggressive selling from the bears.


Subscribe to daily byte-sized crypto news from Cointelegraph
This article is produced in accordance with Cointelegraph's Editorial Policy and is intended for informational purposes only. It does not constitute investment advice or recommendations. All investments and trades carry risk; readers are encouraged to conduct independent research.
More on the subject