
Bitcoin Exchange Inflows Spike as Analyst Expects Pullback to $8.8K
Latest NewsPublishedJul 16, 2020
Traders return coins to exchanges as Bitcoin moves lower, with CryptoQuant expecting a “small” retracement below $9,000.

Bitcoin edging ever closer to a $9,000 support level may lead to a major sell-off by exchange users, one analyst warns.
According to data from on-chain analytics resource CryptoQuant, inflows of Bitcoin (BTC) to exchanges spiked on July 15.
Kraken posts unusual $38.5M daily BTC inflows
When traders return Bitcoin to exchanges from a private BTC wallet, it suggests they have a desire to trade or sell at short notice.
The opposite is also true. As Cointelegraph reported, exchange balances witnessed a long-term downtrend, which in May, hit its lowest since late 2018, when BTC/USD crashed to $3,100.
Now, says CryptoQuant, nervousness over weak price performance appears to be sending a signal to prepare for downward volatility.
Eyeing major trading platform Kraken, data shows that on Wednesday, 4,229 BTC ($38.5 million) entered — far more than the average of 500 BTC ($4.55 million) over the past few weeks.
While order book data is still forthcoming — Kraken may be presenting an anomaly that does not reflect broad trader sentiment — overall conditions are decidedly bearish.
“I expect a small pullback,” CEO Ki Young Ju told Cointelegraph in private comments.
Ki added that should a sell-off begin, he did not foresee it matching that from March, when a cascading short event halved BTC/USD within hours.
“In my opinion, it’ll be around $8,800,” he said.
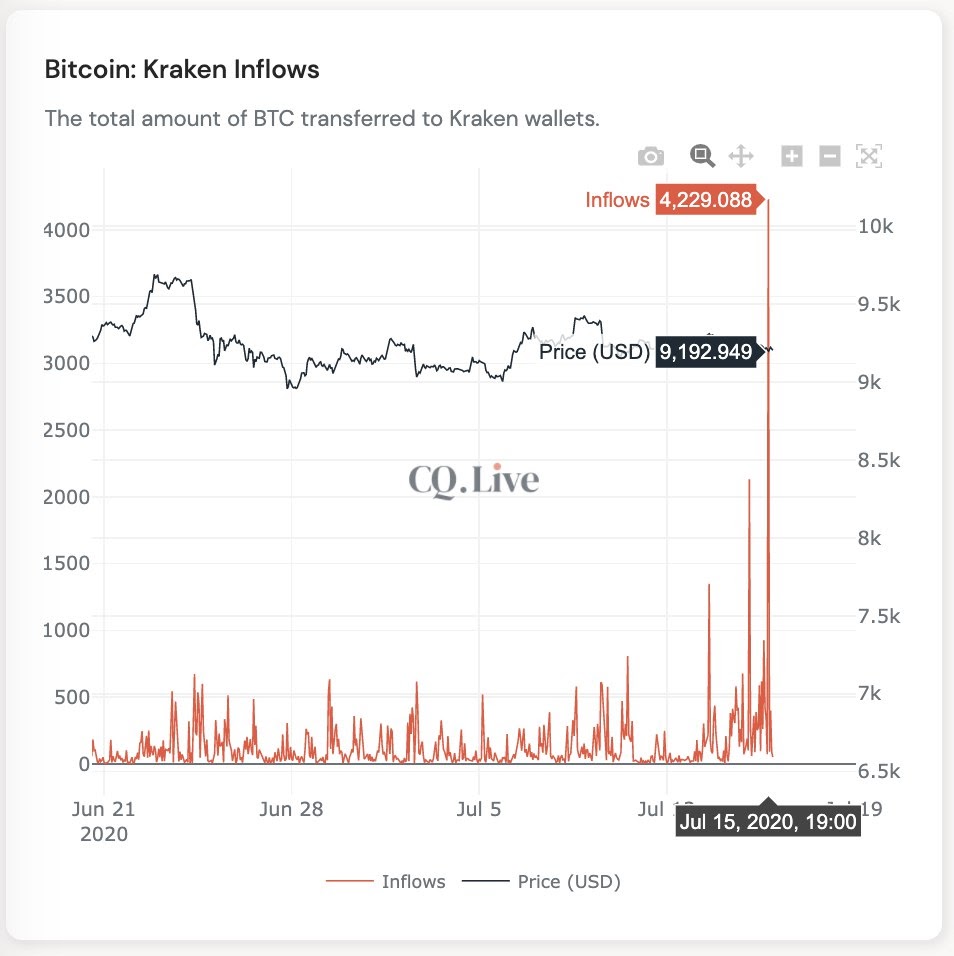
Bitcoin exchange inflows 3-week chart. Source: CryptoQuant
The number is less pessimistic than other recent targets. Earlier this week, Cointelegraph analyst Filbfilb highlighted Bitcoin’s 20-week moving average at $8,200 as a realistic buy support zone.
For all exchanges, meanwhile, inflows remain far below their March-crash levels, indicating a tendency to hold — not sell — is still in place.
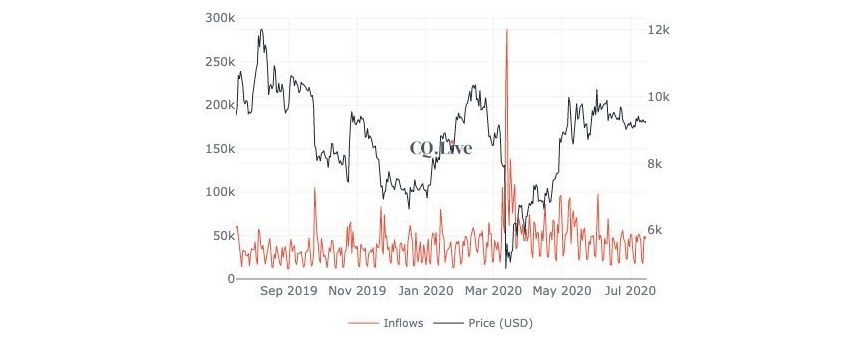
Bitcoin exchange inflows 1-year chart. Source: CryptoQuant
BTC price falls close to $9,000
Bitcoin remains tied to moves on macro markets, which are themselves dictated by sentiment over coronavirus and geopolitical tensions between the United States and China.
The status quo has been hard to shift, and was responsible for the trading corridor in which BTC/USD has failed to exit since the third week of June.
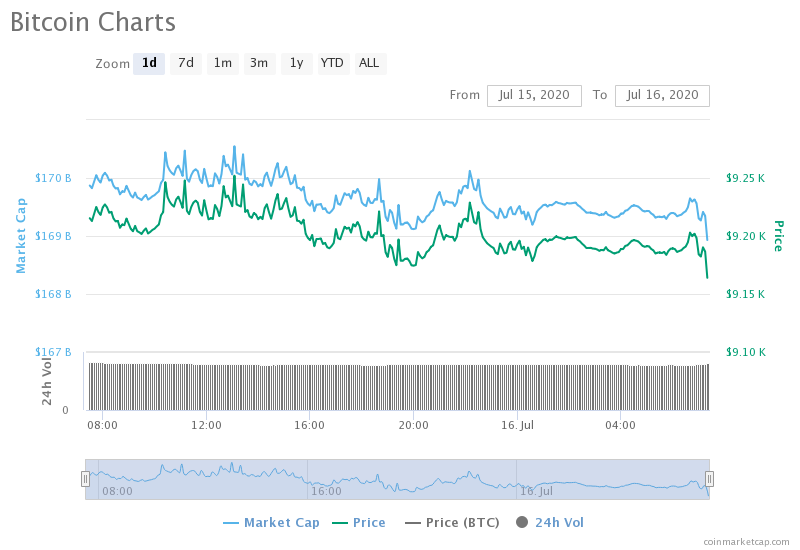
BTC/USD 1-day chart. Source: CoinMarketCap
At press time, the pair traded at $9,080, as selling pressure seemed to mount in line with CryptoQuant’s predictions.
The last time that Bitcoin briefly lost $9,000 was on June 28, reaching highs of $9,480 in the meantime.


Subscribe to daily byte-sized crypto news from Cointelegraph
Cointelegraph is committed to independent, transparent journalism. This news article is produced in accordance with Cointelegraph’s Editorial Policy and aims to provide accurate and timely information. Readers are encouraged to verify information independently.
More on the subject