Bitcoin Price Seals Best Weekly Close in 2.5 Years: 5 Things to Know
Latest NewsPublishedAug 10, 2020
Bitcoin has put in a crucial bull market sign for long-term investors as $12,000 returns to the market — can it hold?

Bitcoin (BTC) greets another week with a push to $12,000 and its highest weekly close since after it hit $20,000 — will it return?
Cointelegraph takes a look at five things that stand to impact BTC price performance in the coming five days.
BTC: A two-and-half-year record weekly close
Bitcoin hitting $12,000 again early Monday was more than just a boon for traders — in doing so, BTC/USD sealed its highest close on weekly time frames since January 2018.
This means that no single week of price action ended at such high levels since, including during the height of last year’s bull market.
Having pleased analysts for several months in the short term, Bitcoin thus followed through on longer timeframes — a crucial move to cement the upward trajectory.
Now, investors seeking confirmation that the bull market will continue may well have received it — versus daily and hourly developments, a multi-year high weekly close is significant.
BTC/USD was thus up 2.4% on the day, with weekly gains sitting at 7% and monthly returns at over 30%.
Price-wise, $12,000 represents the highest that Bitcoin has reached since June 2019, three months after a Q2 bull market took the cryptocurrency from $4,000 to $13,800 — a level which this cycle has yet to reach.
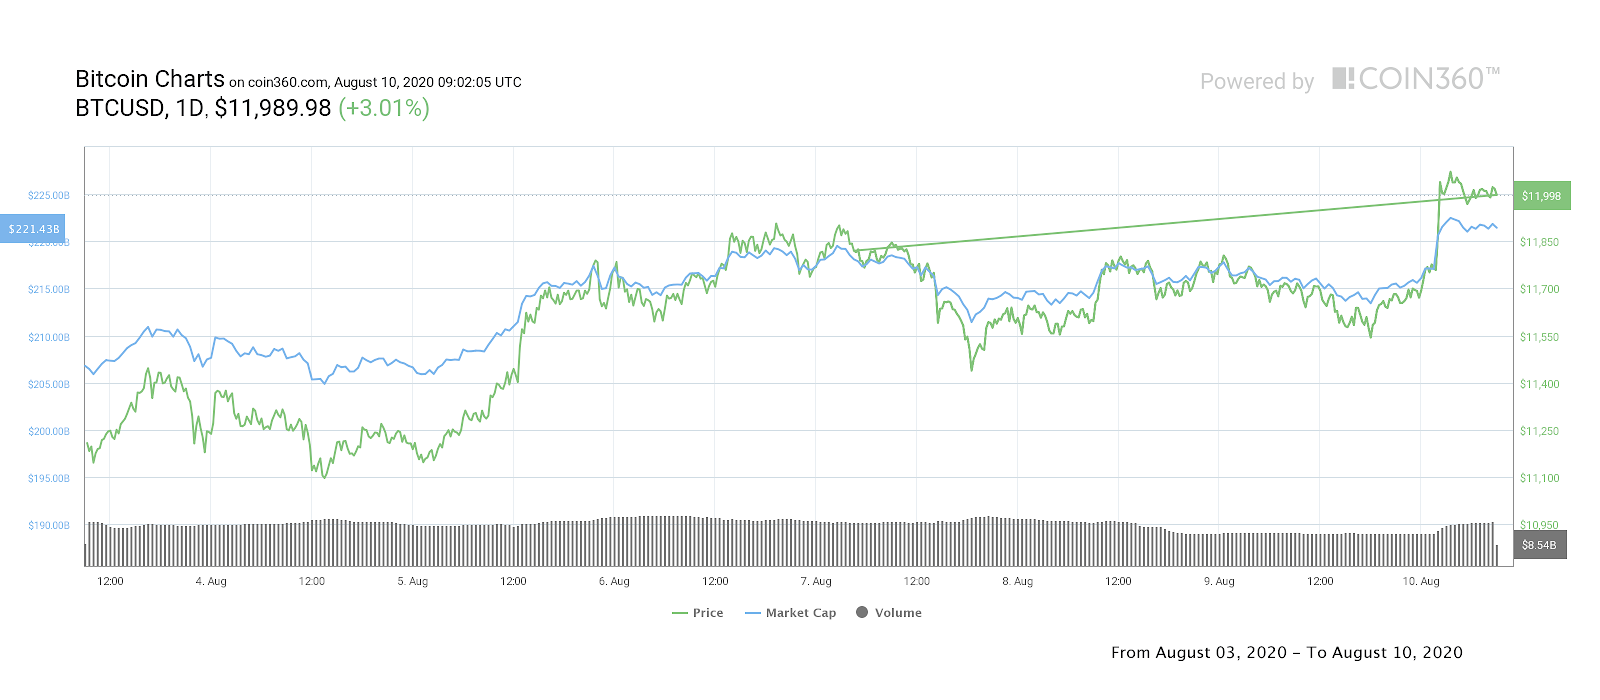
BTC/USD 7-day price chart. Source: Coin360
Trump pushes fiat instability
Bitcoin’s price surge comes the week after United States president Donald Trump added to existing geopolitical tensions by banning Chinese social media platform TikTok.
The resulting escalation of ties with Beijing adds to existing weakness in the U.S. dollar and ongoing concerns over Coronavirus — a perfect storm for a flight to safe haven assets.
At the same time, Trump signed a series of executive orders on Coronavirus stimulus, something which now has a curious impact on markets which are already subject to heavy intervention from the Federal Reserve.
This time around, however, the measures will have a smaller direct effect on the average American. A payroll tax delay, for example, does not go far enough in the eyes of critics.
“This fake tax cut would also be a big shock to workers who thought they were getting a tax cut when it was only a delay,” Bloomberg quoted Democratic Senator Ron Wyden as saying in a statement.
“These workers would be hit with much bigger payments down the road.”
It is this delaying the inevitable financial cost to personal wealth, which lies at the heart of the pro-Bitcoin argument — high-time-preference economic behavior ultimately costs much more in the long term than the immediate benefit to the target audience.
Bitcoin correlation: stocks or gold?
Where Bitcoin might head in the short term is now less clear cut when considering its historical performance versus other macro assets.
The period since March, which saw a cross-asset crash, was marked first by a correlation to stock markets, and then to safe havens and specifically gold.
Gold hit its all-time highs in U.S. dollar terms weeks before Bitcoin began significantly gaining, and its run has continued — until now.
A slight correction took XAU/USD to $2,030 from highs of near $2,075 — should the trend continue, Bitcoin may likewise cool off from its upward momentum.
Nonetheless, as Cointelegraph reported, incoming action from the Fed looks set to buoy the precious metal further in a “wildly bullish” policy shift to expanding inflation way beyond its current rate of 0.6%.
Stocks were likewise looking less stable — analysts were warning over fallout for developing markets thanks to Turkey’s currency crisis, and China sanctioning U.S. officials over Hong Kong added to pressure.
“Bitcoin up as tensions rise in Asia. Capital flight out of Asia taking the Bitcoin express,” RT host Max Keiser summarized, adding:
“You can’t take it with you, unless it’s Bitcoin - then you can take IT ALL with you (Something near impossible with Gold).”
Futures gaps open below for BTC/USD
Another volatile weekend has opened up a classic feature for short-term Bitcoin price forecasting — a “gap” in CME Bitcoin futures markets.
The weekend’s volatility means that futures finished Friday at $11,680 and began again at $11,750. The resulting void provides a key price target, with Bitcoin historically filling such “gaps” within days or even hours.
Last week saw just such a setup emerge, with volatility aiding the trend after weeks of flat price action removed gaps from the market altogether.
Another gap lower down at $9,700 still remains from July.
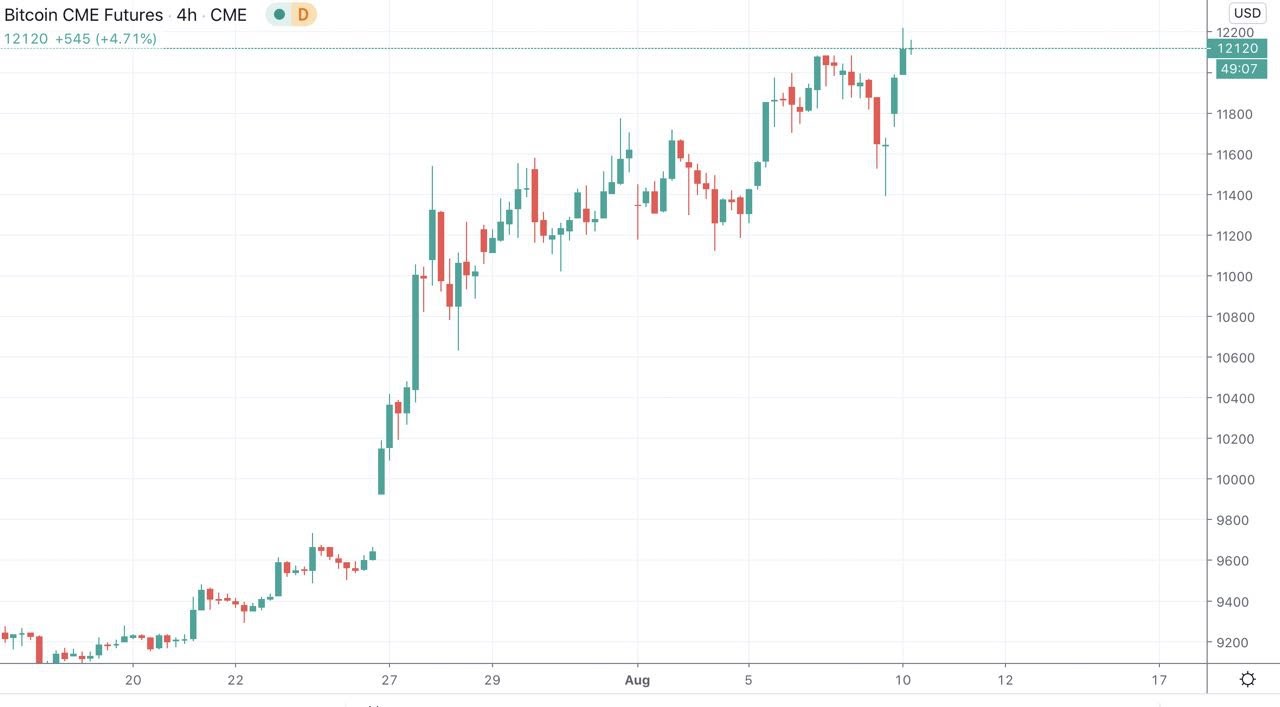
CME Bitcoin futures chart showing recent latest gaps. Source: TradingView
All on schedule
For quant analyst PlanB, creator of Bitcoin’s stock-to-flow price forecasting model, the bullish action of the past weeks is exactly to be expected.
Earlier in August, PlanB noted that BTC/USD was filling out the stock-to-flow chart according to historical precedent — since May’s block subsidy halving, dots have confirmed that current behavior falls within the rules.
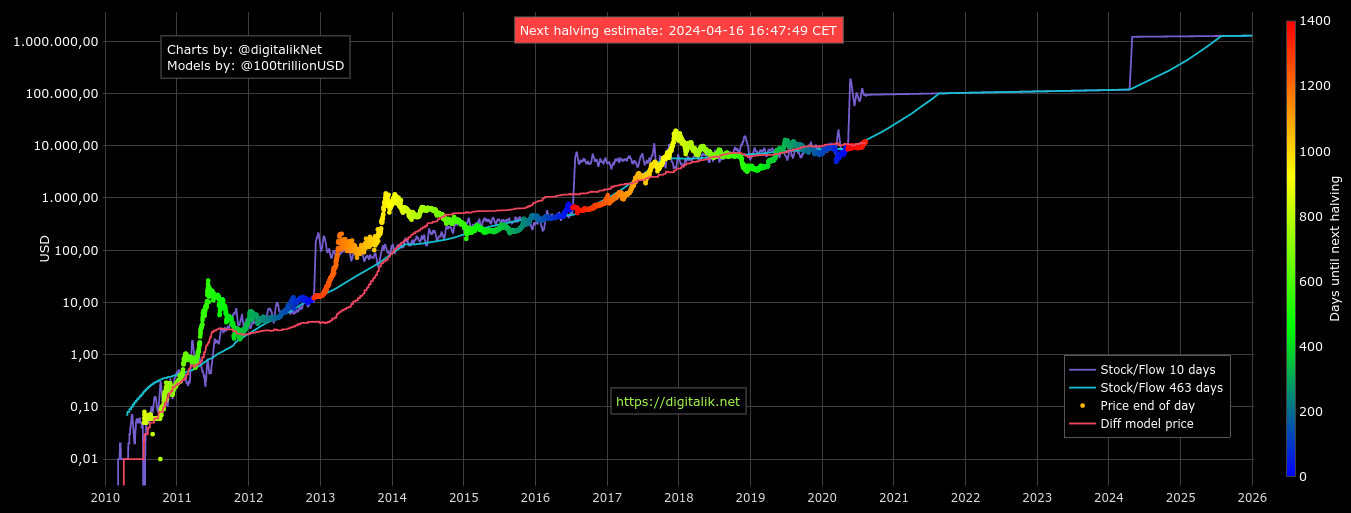
Bitcoin stock-to-flow chart as of August 10. Source: Digitalik
On the topic of major players flipping bullish, meanwhile, he added last week that “when bitcoin was $4k in 2019, lot of big accounts were bearish, predicting $1k.”
Behind the scenes, however, signs were that if $6,000 appeared, the mood would change to favor the bulls.
“That actually happened, we shot through $6k. Now many were bearish at $9k .. $13.5k will be interesting,” PlanB wrote.

Subscribe to daily byte-sized crypto news from Cointelegraph
Cointelegraph is committed to independent, transparent journalism. This news article is produced in accordance with Cointelegraph’s Editorial Policy and aims to provide accurate and timely information. Readers are encouraged to verify information independently.
More on the subject