
Miner Revenues Crash, But This Has Always Marked Bitcoin Price Bottoms
Latest NewsPublishedMay 21, 2020
The drop-off in Bitcoin mining revenue to 2019 levels show a macro bottom for BTC is near as the impact of the halving is starting to be felt.

The revenue of Bitcoin (BTC) miners dropped to early 2019 levels for the second time in 2020. Every time it declined to a multi-year low, it marked the start of a bullish trend for BTC.
The last time the daily revenue of Bitcoin miners hovered at around $7 million was on March 13, 2020. At the time, the price of BTC dropped to as low as $3,600 on BitMEX following a cascade of more than a billion dollars in long contracts.
After mining revenue plunged on March 13, the price of Bitcoin rose from $3,600 to over $10,000 with a 177% gain over the next month and a half.
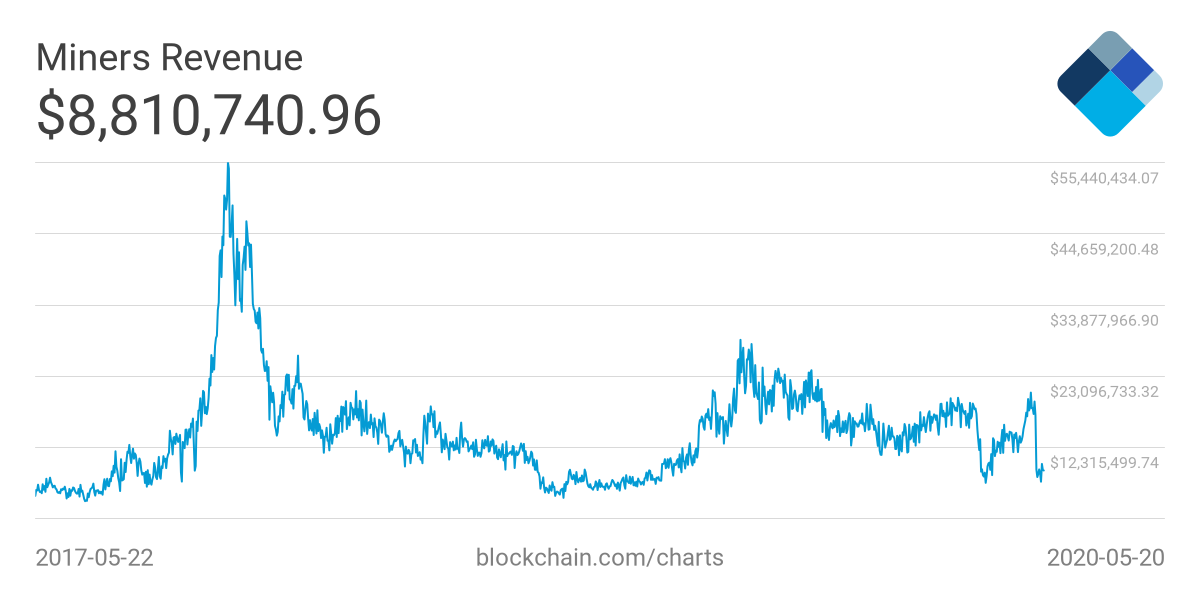
Bitcoin miners revenue drop to early 2019 levels. Source: Blockchain
Bitcoin may see a similar trend in the coming months
When Bitcoin mining revenue falls steeply, it indicates that over-leveraged miners are capitulating due to unfavorable market conditions.
From March 12 to March 13, the mining revenue declined as a result of a 50% drop in the price of Bitcoin in a span of 24 hours. This time, the drop-off is seemingly caused by the effect of the Bitcoin halving on the mining ecosystem.
Before the halving, miners were generating about 1,800 BTC per day in revenue. Today, miners are expected to make around 900 BTC per day.
But the price of Bitcoin is currently at a similar level as where it was before the halving was activated. For small or over-leveraged miners, the stagnancy in the price of Bitcoin following the halving is enough to cause a temporary halt in their operations.
Typically, this marks a bottom for Bitcoin because it indicates a peak level of fear in the market. Some unprofitable miners are shutting down while BTC is stagnant. Therefore, Bitcoin could see short-term volatility as on-chain data suggests the generational bottom before a new bull cycle is seemingly being established.
Other macro indicators also flipping bullish
The Puell Multiple, a macro indicator that uses the daily issuance of BTC to measure the trend of the market, shows that BTC is close to its bottom.
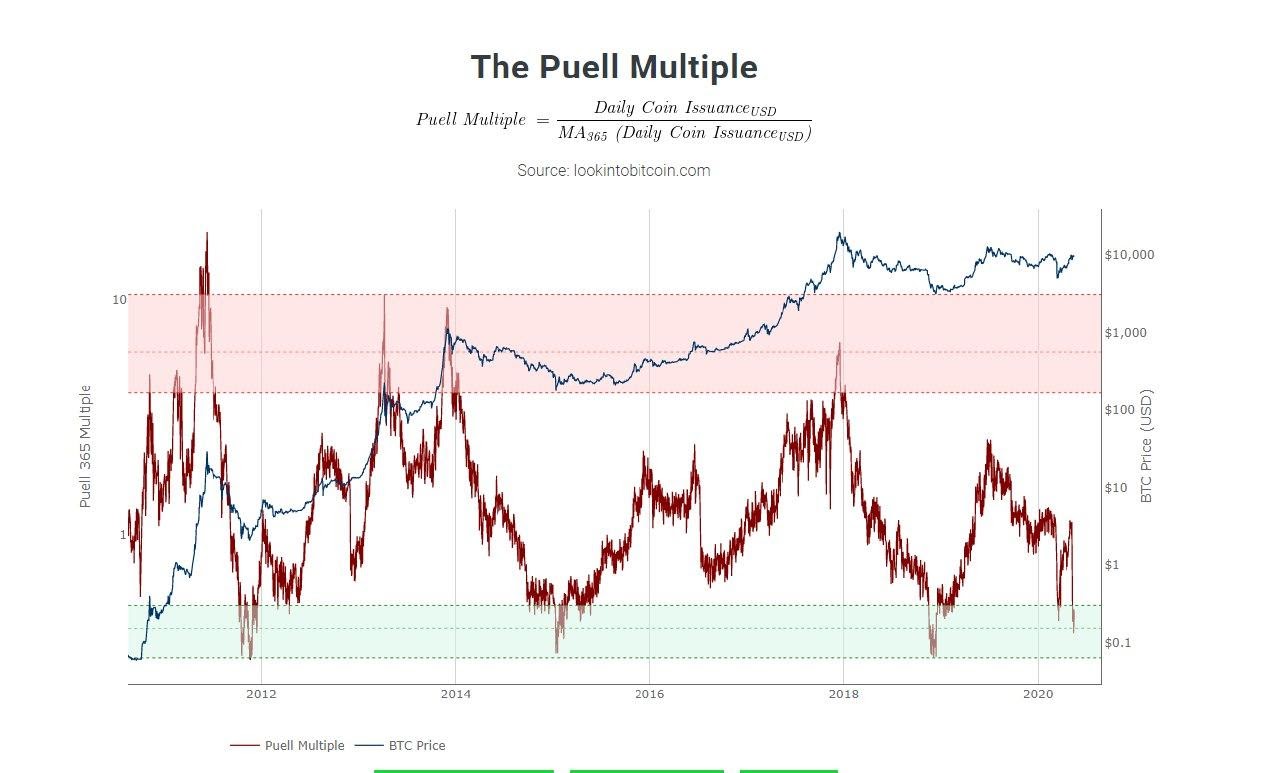
A macro indicator shows Bitcoin is nearing a bottom. Source: Lookintobitcoin
While the Puell Multiple suggests there may be another minor pullback in the short-term, it is showing a 2018-esque trend wherein BTC is gearing towards a bullish trend as seen in early 2019.
From early to mid-2019, the price of Bitcoin rose from $4,000 to $14,000, and various on-chain data suggests BTC is now showing similar signs.
Technical indicators such as the Relative Strength Index (RSI) and the Moving Average Convergence Divergence (MACD) for large time frames also show that BTC is nowhere near the top following a 160% price spike.
Bitazu Capital founding partner Mohit Sorout said:
“Notice how major BTC cycle top & bottoms were printed against the backdrop of peak volatility? Simple look will tell you $10k is a small hiccup.”
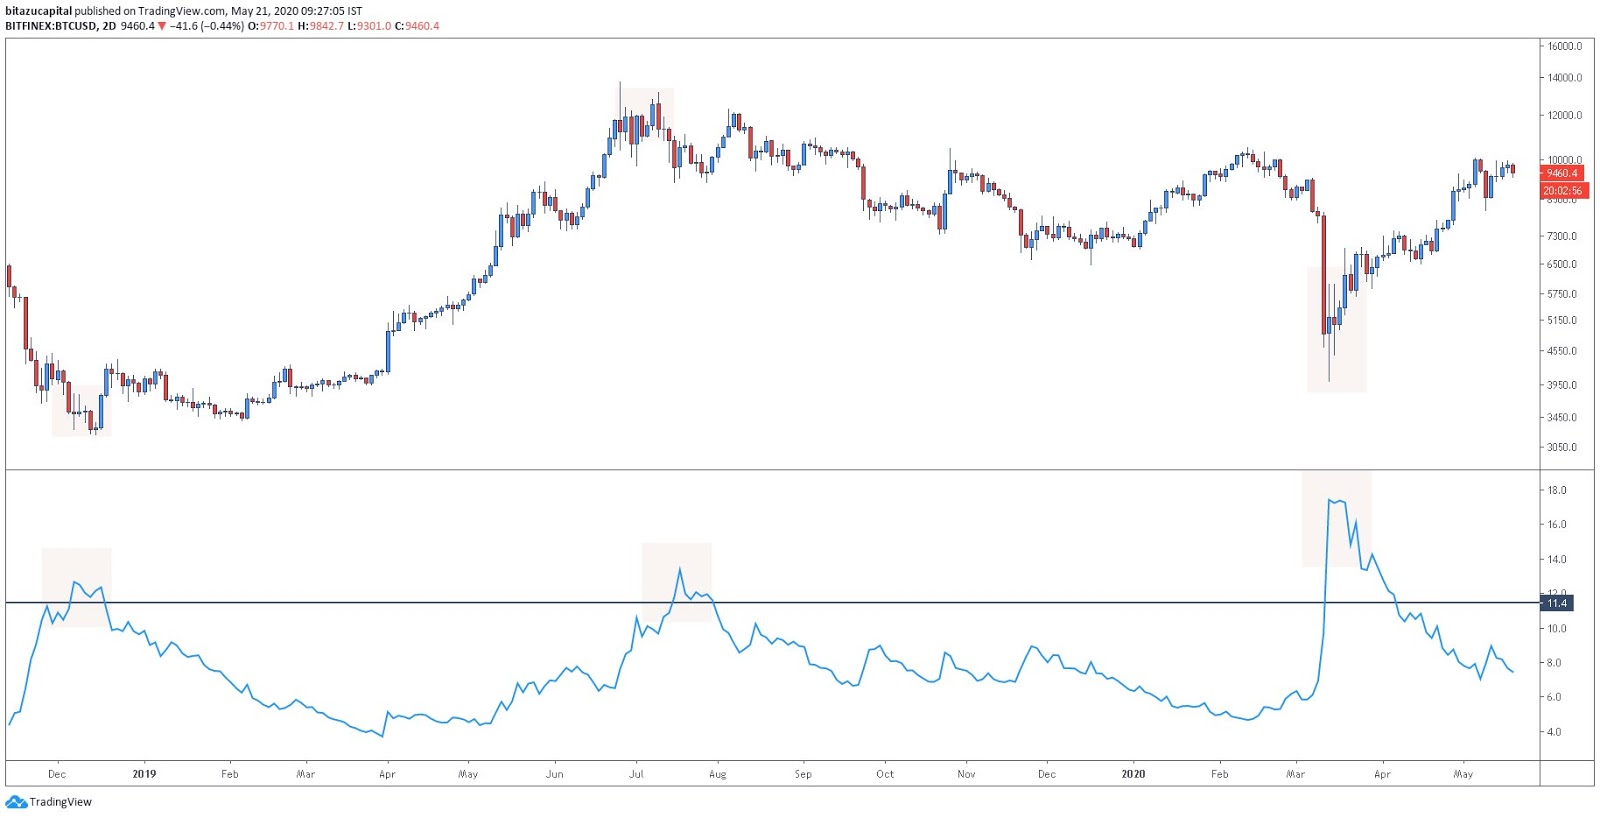
Volatility index shows Bitcoin is not at a local top. Source: Mohit Sorout
The price of BTC nearly tripled since March 13 from $3,600 to $10,085 and yet, historically accurate indicators are not showing a top-like structure for BTC.

Subscribe to daily byte-sized crypto news from Cointelegraph
Cointelegraph is committed to independent, transparent journalism. This news article is produced in accordance with Cointelegraph’s Editorial Policy and aims to provide accurate and timely information. Readers are encouraged to verify information independently.
More on the subject