


 Written by Biraajmaan Tamulystaff writerEdited by Ray Salmondstaff editor
Bitcoin dip buyers place $500M in bids as $70K retest looms
MarketsPublishedMay 29, 2026
Over $500 million in Bitcoin bids now sit near $70,000, while options traders and futures positions converge around the same level.

Bitcoin (BTC) traders have placed new buy orders near $70,000 as the price approaches a key liquidity zone. Order-book data shows more than $500 million in bid liquidity between $72,000 and $70,000, creating a demand zone that could shape BTC’s next move.
BTC buy bids form key support zone
Data from CoinGlass shows dip buyers have placed 6,235 BTC in bid liquidity between $72,000 and $70,000. At current prices, the buy orders are worth roughly $443 million.
The largest cluster sits directly above $70,000, where buyers are positioned to absorb the current selling pressure. Bid liquidity refers to limit buy orders waiting below the market price. When price trades into those orders, it can slow a decline and trigger a sharp rebound if demand absorbs available BTC supply.
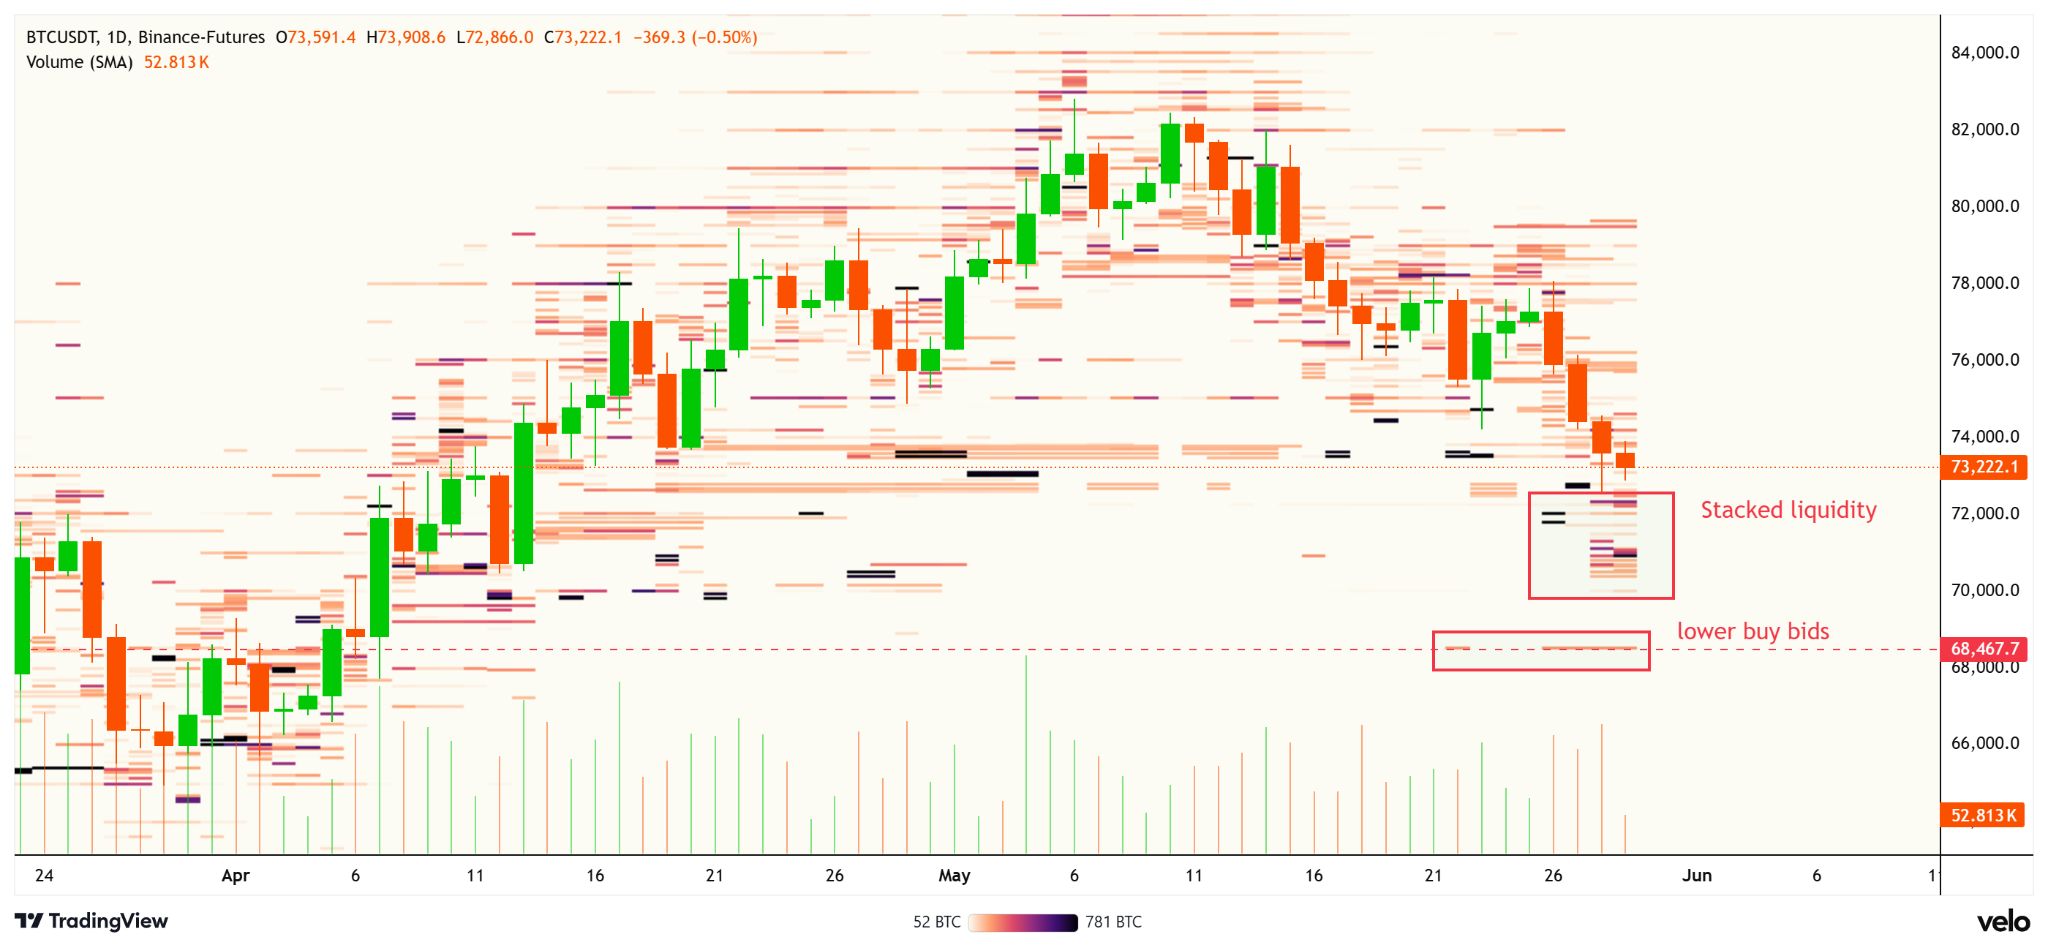
BTC/USD, one-day chart, buy liquidity analysis. Source: Velo chart
Below $70,000, the next notable pocket of demand sits at $68,505, where traders have placed another 1,012 BTC worth approximately $69 million. Outside that level, the order book thins considerably, with few visible bids below $68,500.
Meanwhile, liquidation heatmap data shows about $2 billion in cumulative long positions at risk near $70,000, compared to more than $5 billion in short positions around $78,000. Once BTC taps the bid cluster near $70,000, the larger liquidity pool may trigger a sharp rebound toward overhead liquidation zones.
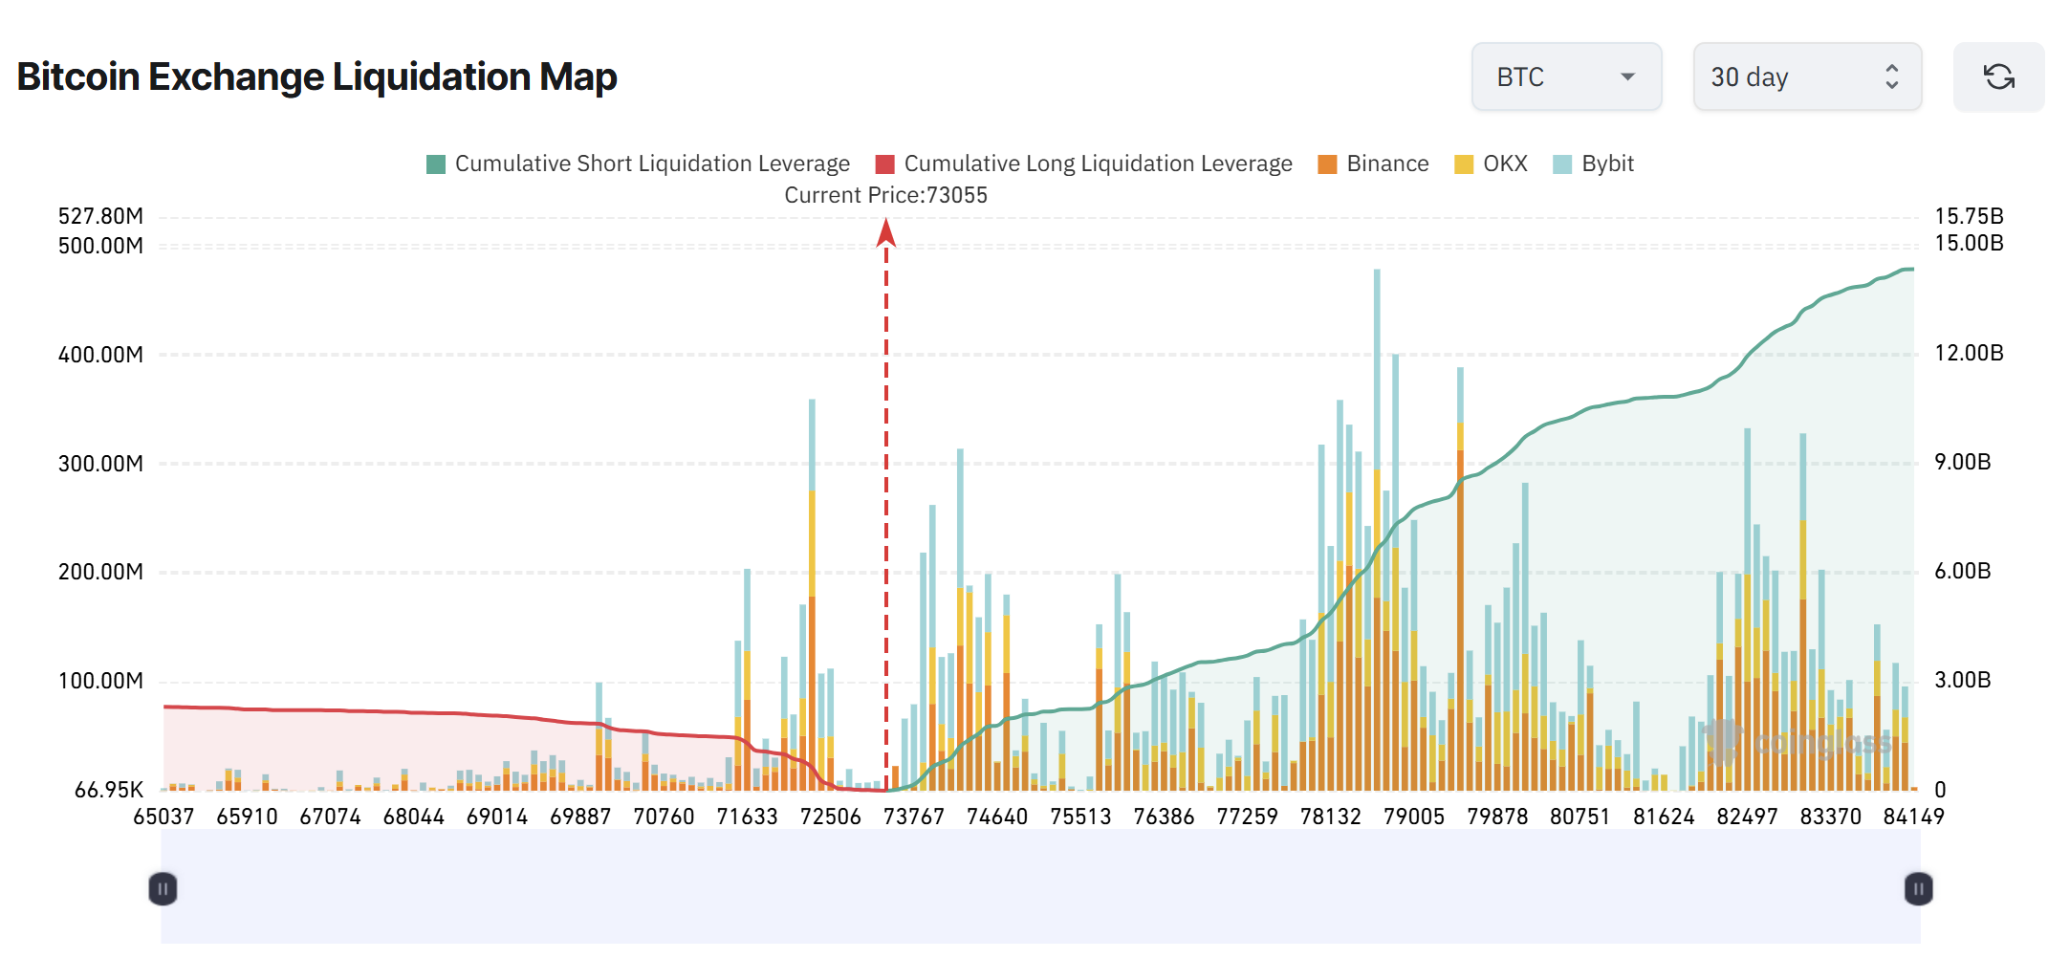
BTC liquidation map. Source: CoinGlass
Related: Bitcoin falls out of the global top 10 assets as market cap dips below $1.5T
RSI hits three-month low as daily BTC trend turns bearish
Bitcoin’s daily trend turned bearish after losing support at $74,800, confirming a pattern of lower highs and lower lows. The price is trading inside a descending channel and is currently testing support near the lower boundary around $72,000–$73,000.
The relative strength index (RSI) has fallen to roughly 33, its lowest level since Feb. 24. Momentum has stayed below the neutral 50 level throughout the recent decline, suggesting sellers still control the short-term price action.
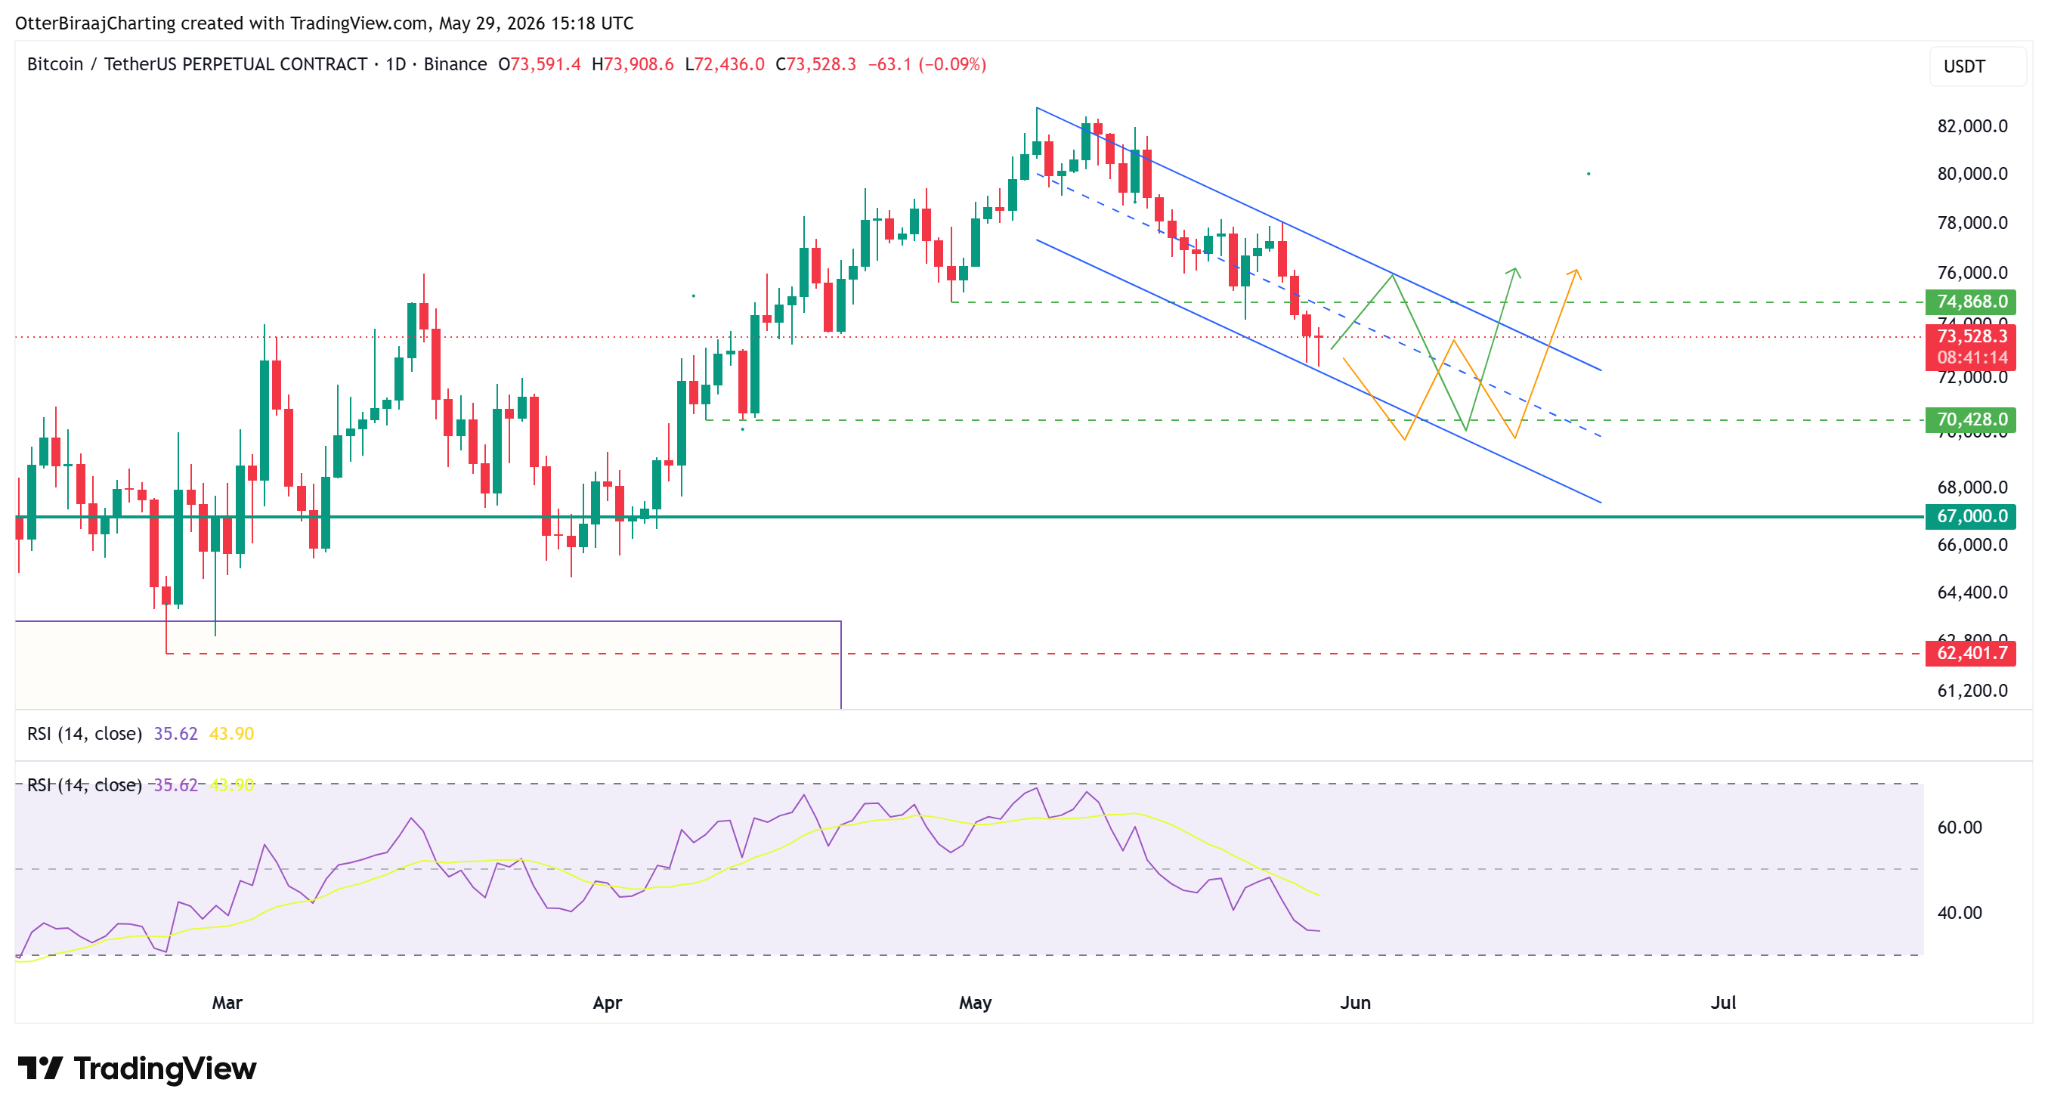
BTC/USD, one-day chart. Source: Cointelegraph/TradingView
Crypto trader Ardi outlined a similar view. The analyst said the $74,500–$75,500 region now acts as resistance across multiple time frames. A rejection from that area could keep focus on the $71,500 region, while a move through channel resistance near $76,000 may challenge the ongoing downtrend.
Options markets show investors have also been preparing for a move toward $70,000. According to Glassnode, traders spent nearly $10 million on put options with a $70,000 strike during the recent dip.
Put options rise in value when prices fall, making them a common hedge against downside risk. Recent flows show some easing in that protection demand as traders lock in profits, though the concentration of hedging activity highlights how closely the market is watching the $70,000 level.
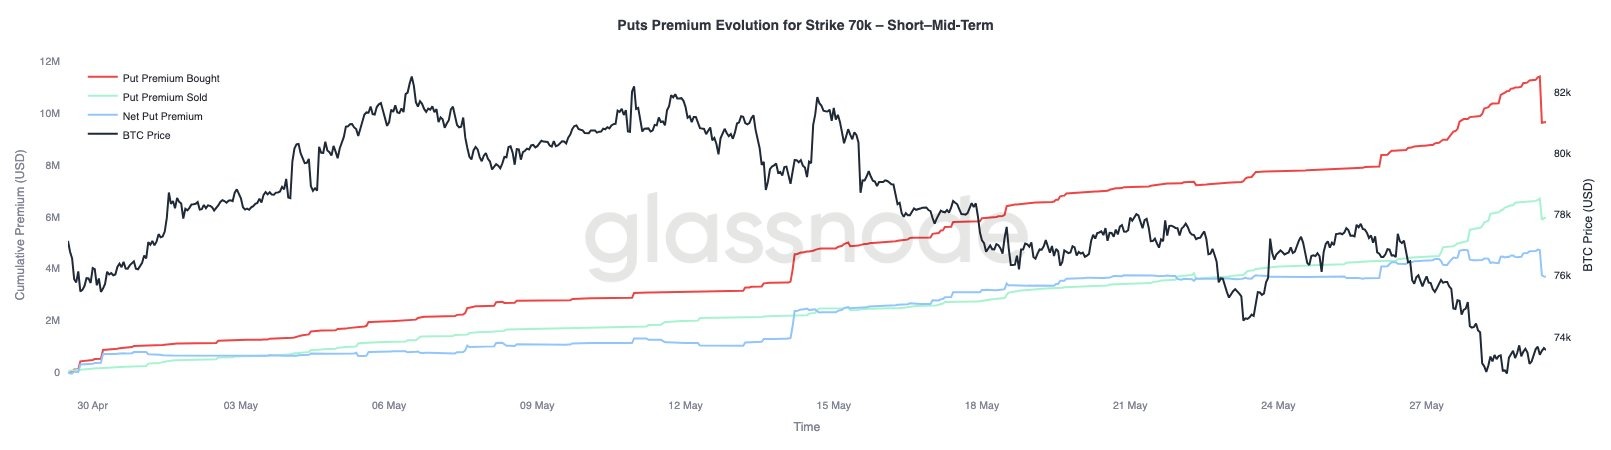
BTC options market analysis at $70,000. Source: Glassnode/X
Related: Bitcoin’s major holders halt buys as demand slows: CryptoQuant


Subscribe to daily byte-sized crypto news from Cointelegraph
This article is produced in accordance with Cointelegraph's Editorial Policy and is intended for informational purposes only. It does not constitute investment advice or recommendations. All investments and trades carry risk; readers are encouraged to conduct independent research.
More on the subject