


 Written by Rakesh Upadhyaystaff writerEdited by Ray Salmondstaff editor
Price predictions 5/29: BTC, ETH, BNB, XRP, SOL, DOGE, HYPE, ZEC, ADA, XMR
MarketsPublishedMay 29, 2026
Bitcoin bears pushed the price closer to $70,000, but dip buyers and HYPE’s outperformance show investors are still bullish on crypto markets.

Key points:
- Bitcoin remains under pressure, but select analysts believe the downside may be limited.
- Most major altcoins have continued to skid toward their support levels, but HYPE remains in a solid uptrend.
Bitcoin (BTC) has dipped below $73,000, signaling that the bears are unwilling to relinquish their control. The incessant outflows from US spot BTC exchange-traded funds are not helping matters either. Farside Investors’ data shows net outflows of $2.83 billion since May 15, indicating institutional investors have turned cautious and are dumping their positions.
However, a minor advantage for the bulls is that BTC’s long-term holders are not hurrying to exit their positions during the latest drop below $75,000. That suggests the pace of fall may slow down below $75,000.
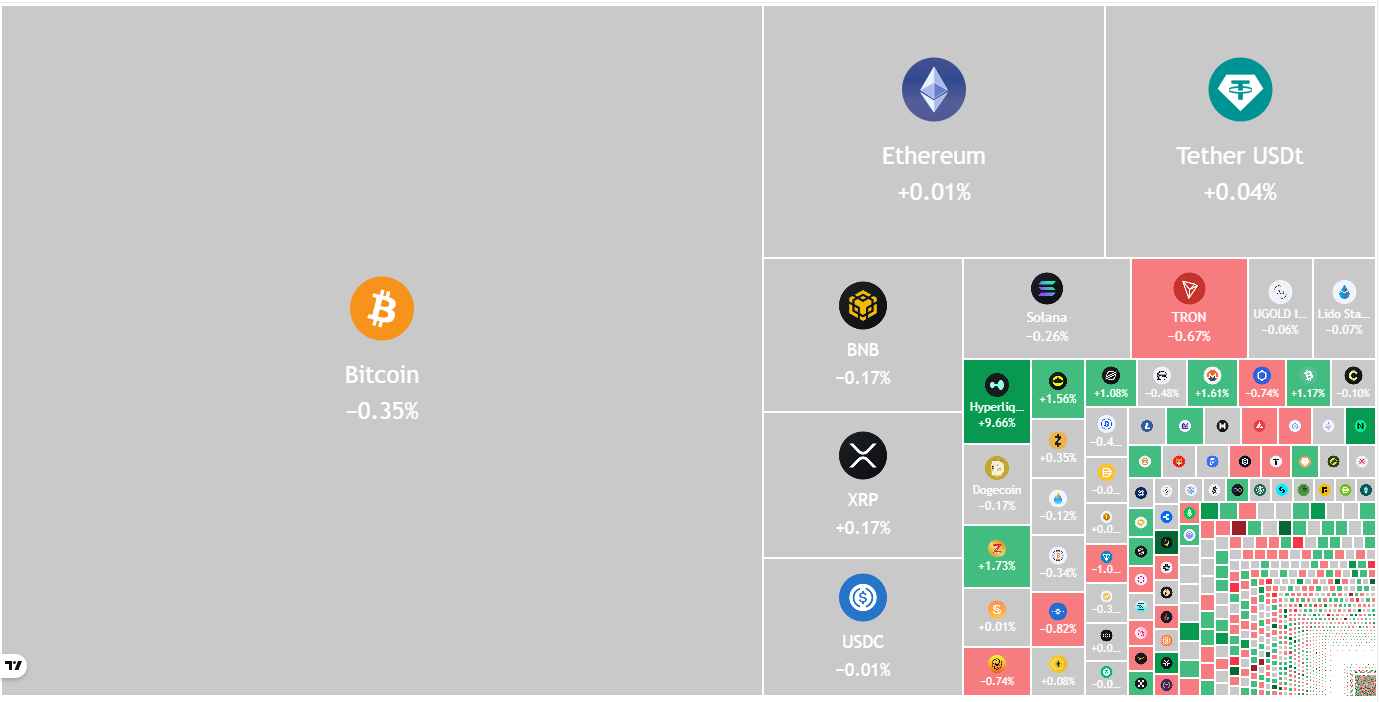
Crypto market data daily view. Source: TradingView
Another metric indicating a possible near-term recovery is the true retail longs-and-shorts accounts, which show the percentage of retail futures accounts holding long positions, currently above 64%. Hyblock analysts said in a post on X that if a trader goes long on a 15-minute candle when the true retail account is above 64%, then 88% of the candles result in a positive 7-day forward return.
What are the crucial support levels to watch out for in BTC and the major altcoins? Let’s analyze the charts of the top 10 cryptocurrencies to find out.
Bitcoin price prediction
BTC continues its downward move toward the support line, where the buyers are expected to step in.
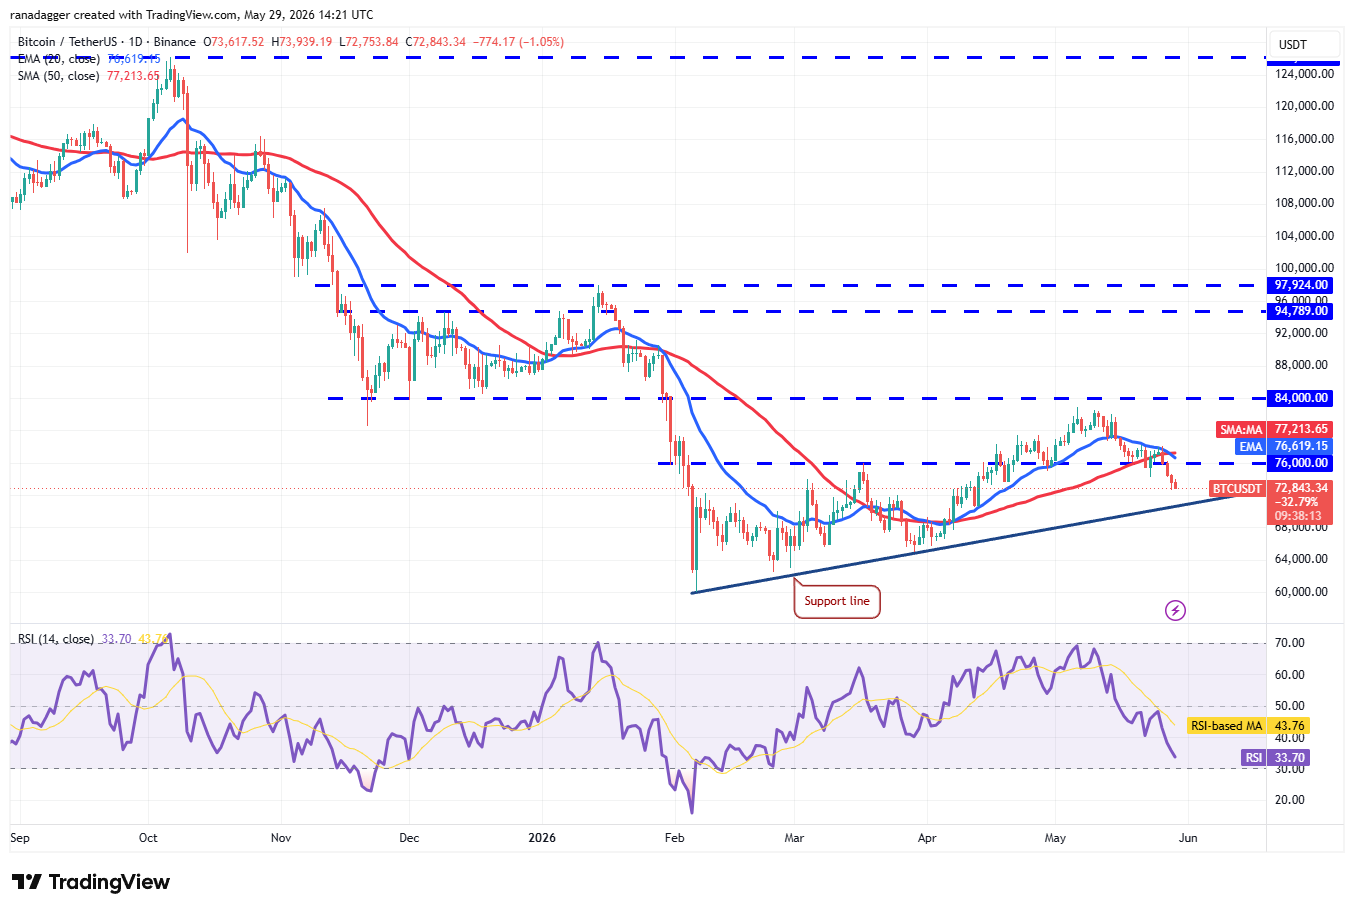
BTC/USDT daily chart. Source: Cointelegraph/TradingView
Any attempt to start a rebound is expected to face selling at the 20-day exponential moving average ($76,619). If the BTC price turns down sharply from the 20-day EMA, it increases the risk of a break below the support line. The BTC/USDT pair may then tumble to $65,000 and eventually to $60,000.
Buyers will have to thrust the price back above the moving averages to signal strength. That indicates demand at lower levels and opens the door to moves toward $80,000 and then $84,000.
Ether price prediction
Ether (ETH) has been gradually sliding toward the $1,916 support, indicating that the bears continue to exert pressure.
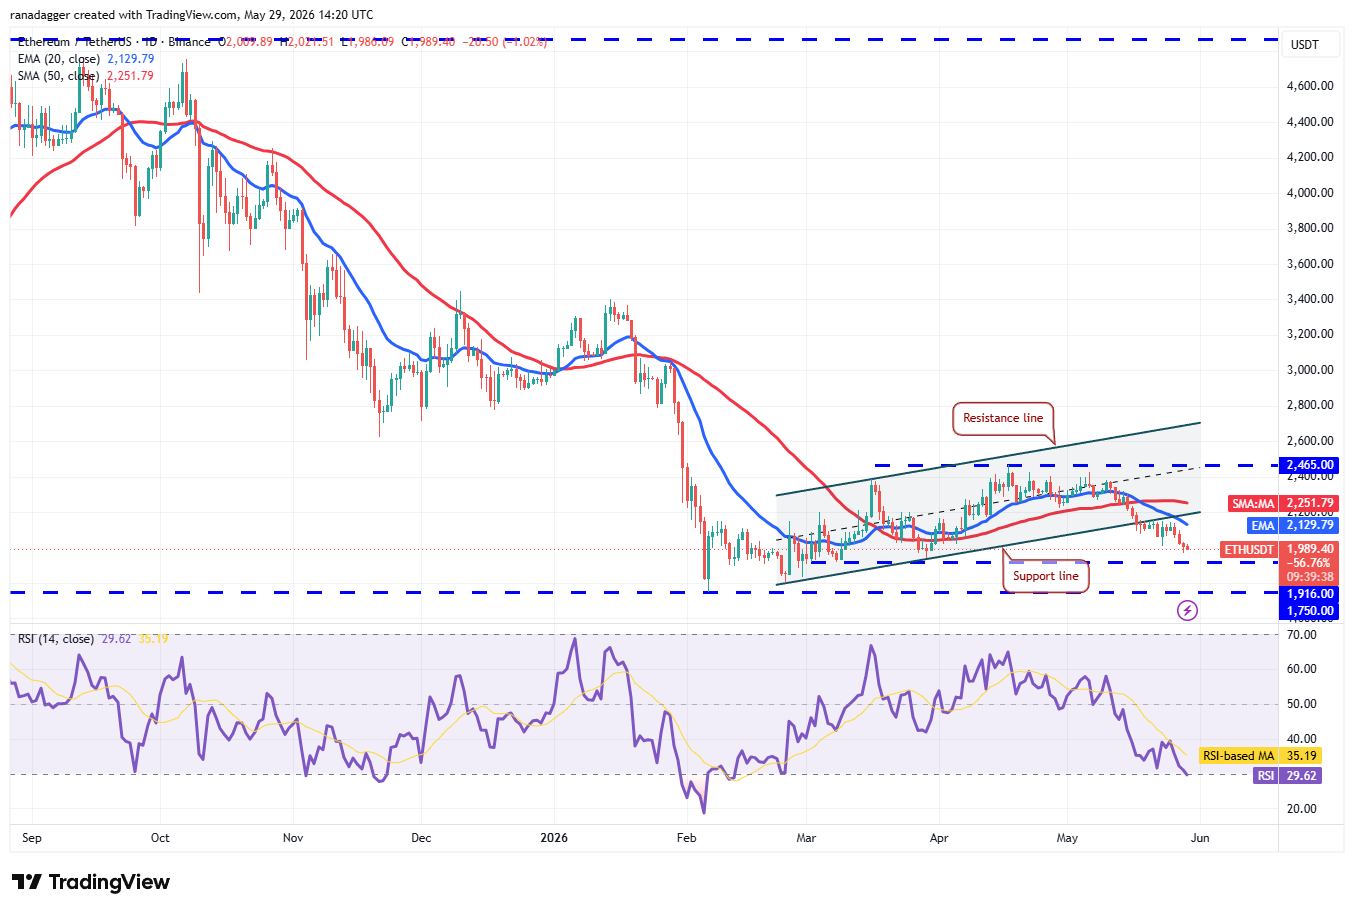
ETH/USDT daily chart. Source: Cointelegraph/TradingView
Buyers are expected to defend the $1,916 level, but are likely to face selling at the 20-day EMA ($2,129) on the way up. If the ETH price turns down sharply from the 20-day EMA, the risk of a drop to the $1,750 support increases.
Instead, if buyers drive the price above the moving averages, it suggests that the ETH/USDT pair may consolidate between $1,916 and $2,465 for some time. A new up move may begin on a close above $2,465.
BNB price prediction
BNB (BNB) has dipped below the 50-day simple moving average ($638), indicating that the bears have a slight edge in the near term.
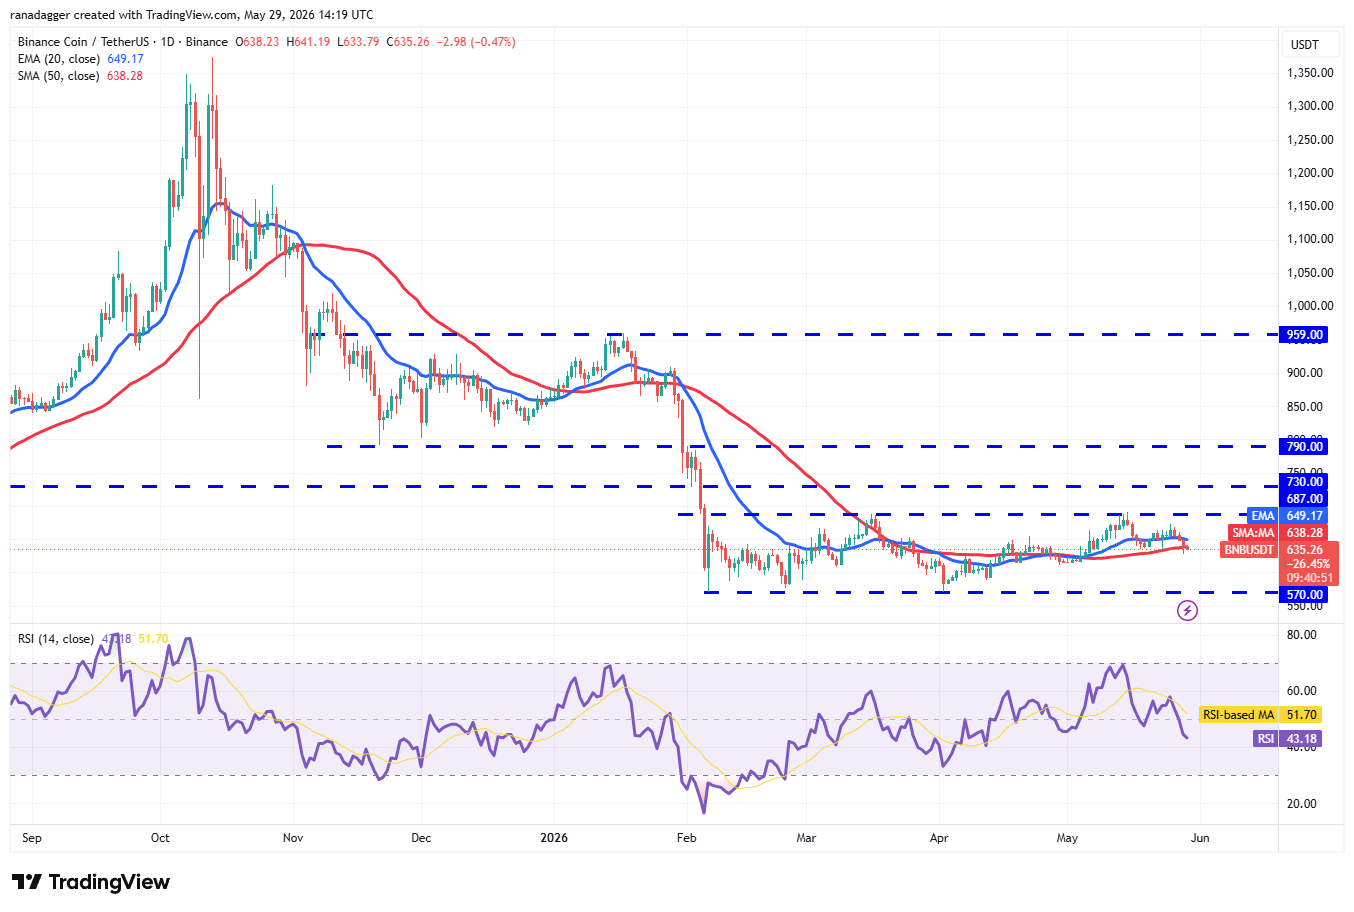
BNB/USDT daily chart. Source: Cointelegraph/TradingView
There is minor support at $610, but that is likely to be broken. The BNB/USDT pair may then plunge to $570.
The next trending move is expected to begin on a close above $687 or below $570. Until then, the range-bound action is likely to continue.
On the downside, a break and close below $570 signals the resumption of the downtrend. The next support is at $500. On the upside, a close above $687 suggests the start of a new uptrend toward $730 and subsequently $790.
XRP price prediction
XRP (XRP) turned up from the $1.27 support on Thursday, but the rebound lacks strength. That suggests the absence of aggressive buying by the bulls.
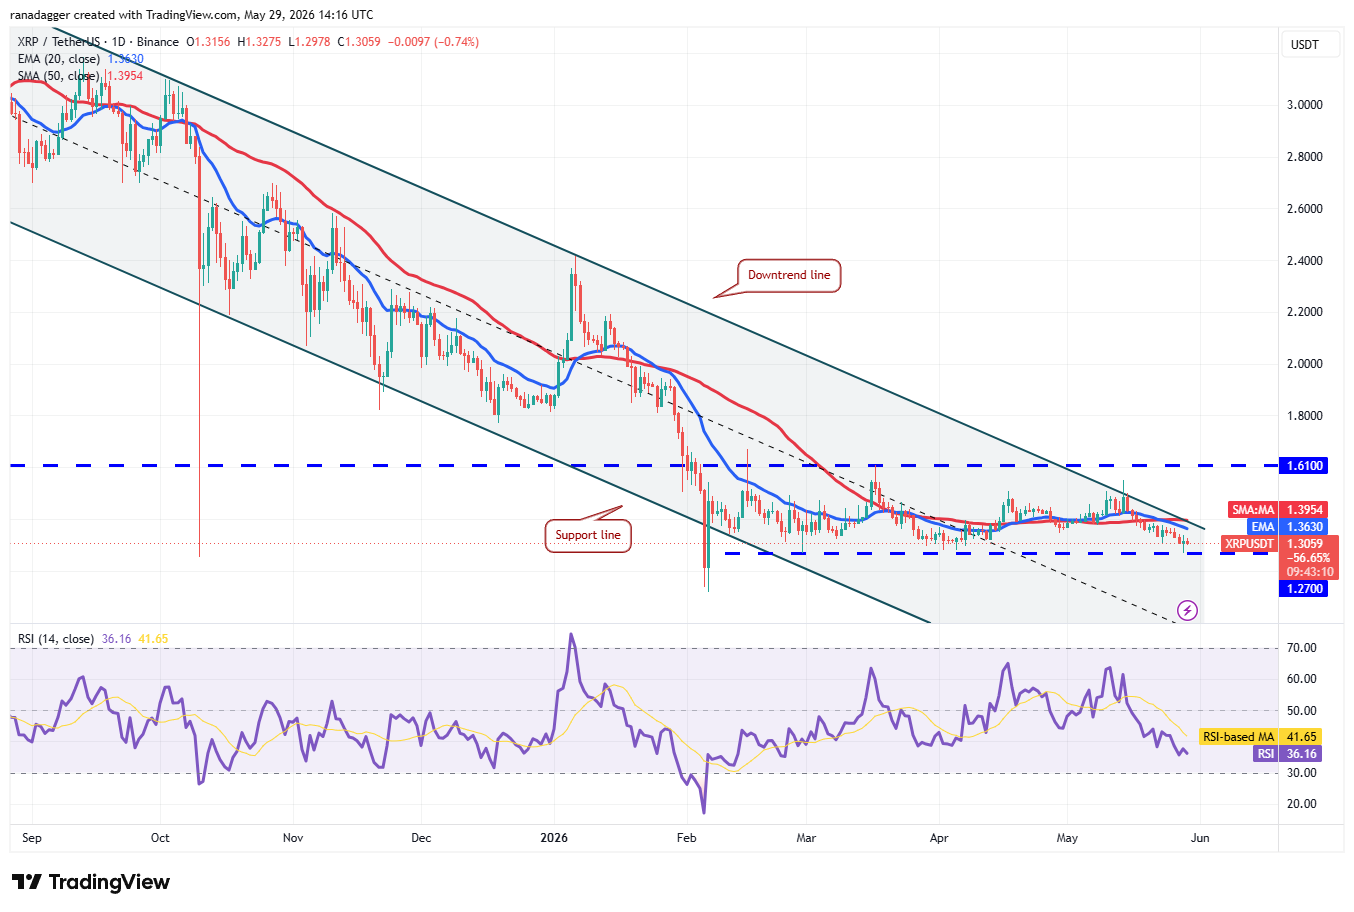
XRP/USDT daily chart. Source: Cointelegraph/TradingView
The bears will attempt to strengthen their position by pushing the XRP price below the $1.27 support level. If they manage to do that, the XRP/USDT pair may plummet to $1.11 and then to the psychological support at $1.
Buyers face a difficult task. They will have to push and maintain the price above the downtrend line to signal the start of a relief rally. The bulls will be back in the driver’s seat on a close above $1.61.
Solana price prediction
Solana (SOL) fell below the $82.65 support on Thursday, indicating that the bears remain in control.
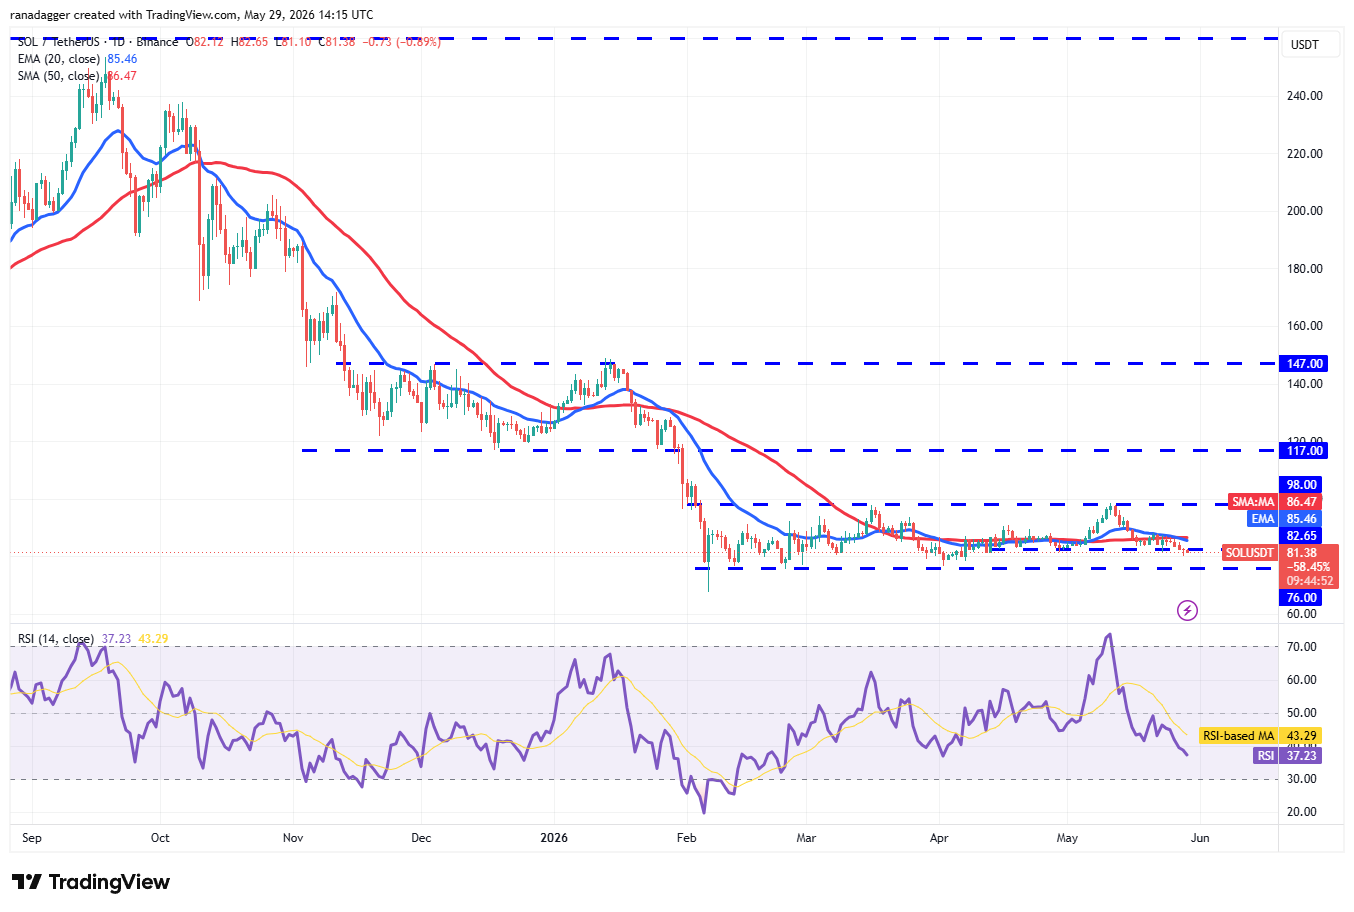
SOL/USDT daily chart. Source: Cointelegraph/TradingView
The bulls are attempting to push the price back above $82.65, but the relief rally is expected to face selling pressure at the 20-day EMA ($85.46). If the SOL price turns down sharply from the 20-day EMA, the likelihood of a drop to $76 increases. Buyers are expected to defend the $76 level, as a close below it may sink the SOL/USDT pair to $67.
Buyers will have to push the price above the moving averages to suggest the pair may remain stuck in the $76 to $98 range for a while longer.
Dogecoin price prediction
Dogecoin (DOGE) remains stuck inside the $0.09 to $0.12 range, indicating buying on dips and selling on rallies.
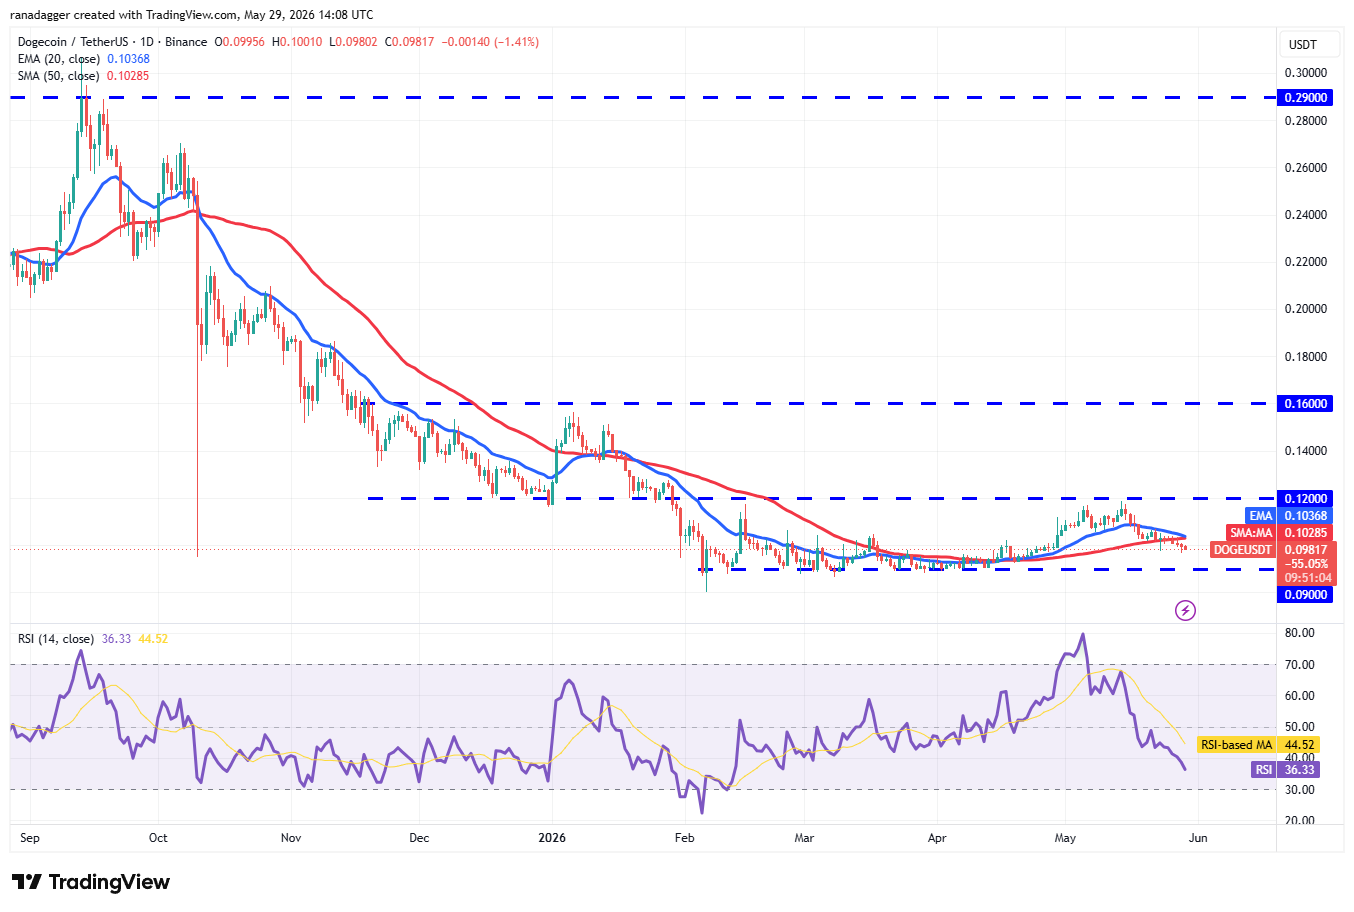
DOGE/USDT daily chart. Source: Cointelegraph/TradingView
The 20-day EMA ($0.10) has started to turn down, and the relative strength index (RSI) is in negative territory, indicating that the bears have the advantage. The DOGE/USDT pair may plummet to $0.09, a level likely to attract buyers. If the DOGE price rises from the current level or the $0.09 support and breaks above the moving averages, it suggests the pair may extend its stay within the range for a few more days.
A close below the $0.09 level clears the path for a decline to the Feb. 6 low of $0.08. Alternatively, a close above $0.12 signals the start of a new uptrend toward $0.14 and then $0.16.
Hyperliquid price prediction
Hyperliquid (HYPE) rose sharply from $56.36, suggesting that bulls view the dips as buying opportunities.
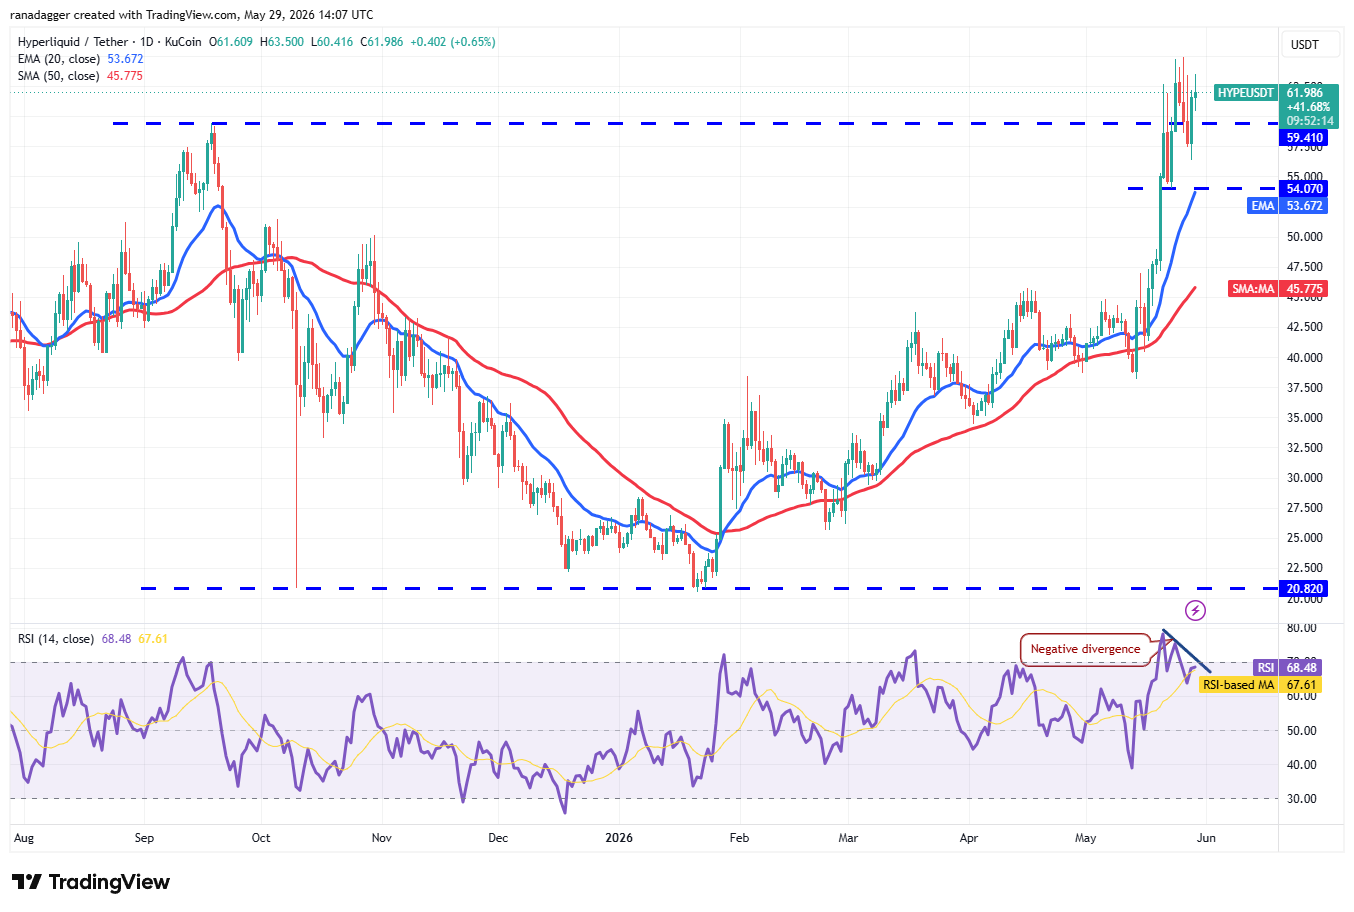
HYPE/USDT daily chart. Source: Cointelegraph/TradingView
The upsloping moving averages indicate an advantage to buyers, but the developing negative divergence on the RSI suggests that the bullish momentum may be weakening. Sellers will have to pull the HYPE price below the 20-day EMA ($53.67) to seize control.
This negative view will be invalidated in the near term if the price continues higher and breaks above $64.93. The HYPE/USDT pair may then start the next leg of the uptrend toward $77.
Related: Why is Stellar's XLM up by over 50% this week?
Zcash price prediction
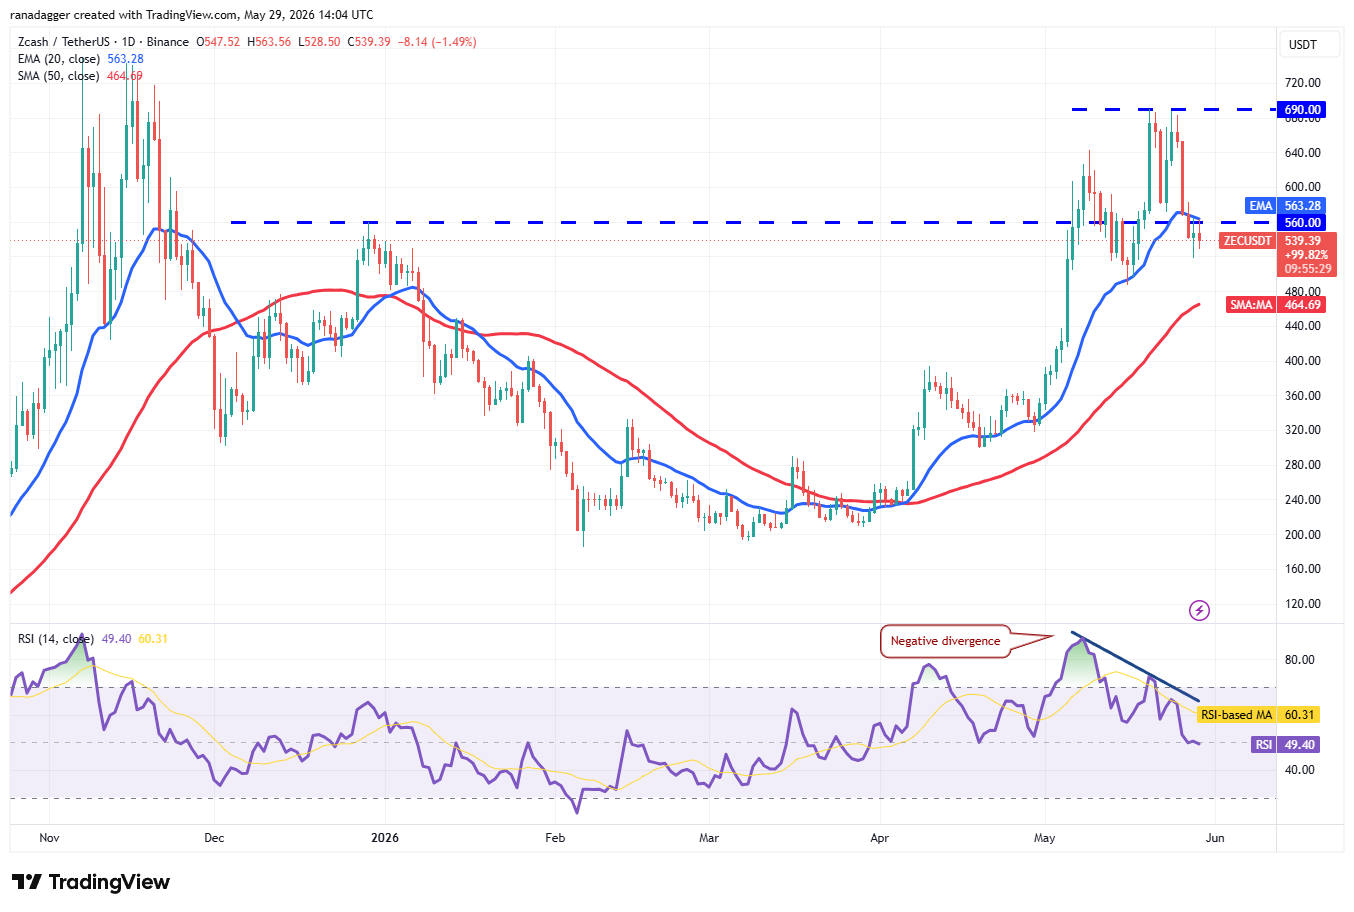
Zcash (ZEC) closed below the 20-day EMA ($563) on Wednesday, and the bears thwarted attempts by the bulls to reclaim the level on Thursday.
ZEC/USDT daily chart. Source: Cointelegraph/TradingView
Sellers will attempt to strengthen their position by pulling the ZEC price to $486 and later to the 50-day SMA ($464). The deeper the pullback, the longer it is likely to take for the uptrend to resume.
The first sign of strength will be a break and close above the 20-day EMA. That suggests buying on dips and improves the prospects of a retest of the $690 level. A close above $690 may catapult the ZEC/USDT pair to $750.
Cardano price prediction
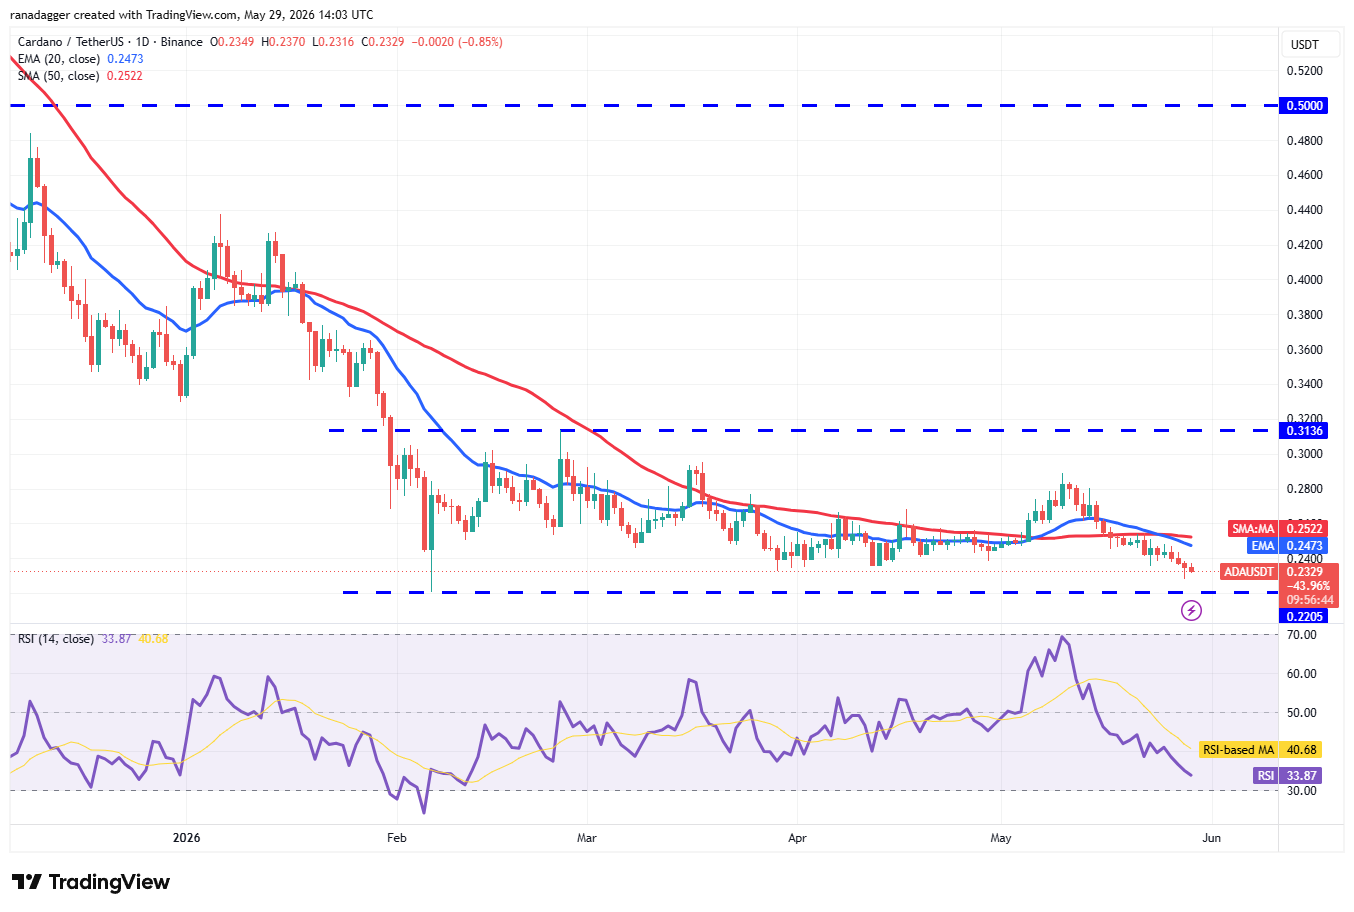
Cardano (ADA) remains under pressure, falling toward the support of the $0.22 to $0.31 range.
ADA/USDT daily chart. Source: Cointelegraph/TradingView
Buyers will attempt to defend the $0.22 level, but the recovery is expected to face selling at the moving averages. If the price drops sharply from the moving averages, the bears will aim to push the ADA/USDT pair below the $0.22 support. If they succeed, the pair may resume the downtrend toward $0.20.
Conversely, if the ADA price rises and closes above the moving averages, it suggests that the pair may extend its stay within the range for some time.
Monero price prediction
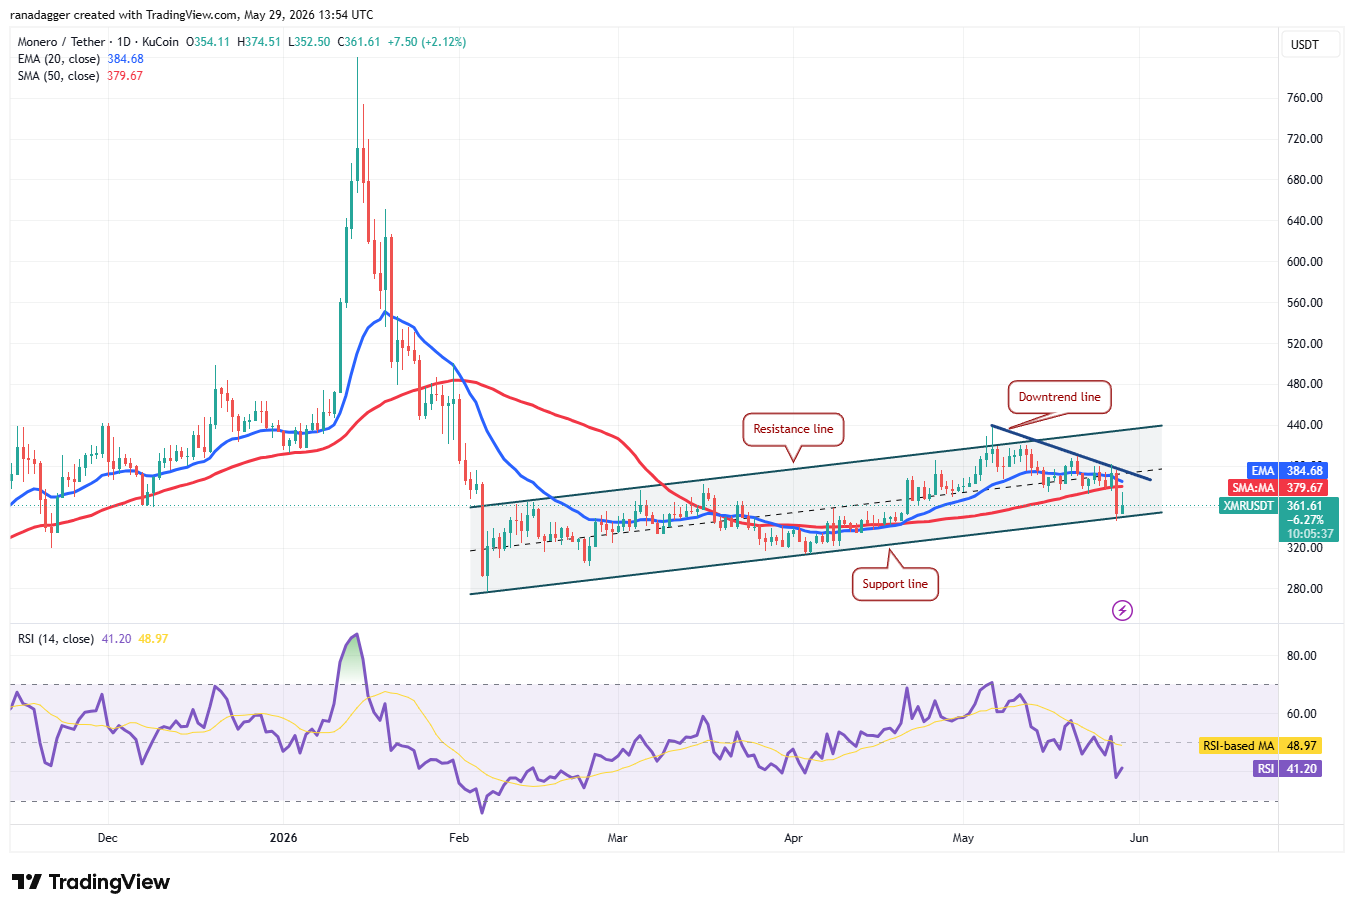
Monero (XMR) declined sharply from the downtrend line on Thursday, suggesting the bears are attempting to take charge.
XMR/USDT daily chart. Source: Cointelegraph/TradingView
The bulls attempted a recovery from the support line, but the long wick on the candlestick shows that the bears continue to sell on minor relief rallies. That increases the risk of a break below the support line. If that happens, the XMR/USDT pair may tumble to $313 and then to $302.
Buyers will have to push and maintain the XMR price above the downtrend line to signal strength. If they manage to do that, the pair may remain inside the ascending channel pattern for some more time. The bullish momentum is likely to pick up after buyers secure a close above the resistance line.


Subscribe to daily byte-sized crypto news from Cointelegraph
This article is produced in accordance with Cointelegraph's Editorial Policy and is intended for informational purposes only. It does not constitute investment advice or recommendations. All investments and trades carry risk; readers are encouraged to conduct independent research.
More on the subject