
Crypto Fear and Greed rebounds off extreme lows as traders re-enter
MarketsPublishedMar 18, 2026
The Crypto Fear and Greed Index just ended a 48-day stretch in the “extreme fear” zone, signalling improving sentiment among investors. Will fresh capital inflows reignite the bull market?

The Crypto Fear & Greed Index remained at 26 on Wednesday, after rising to 28, a day earlier, ending the indicators’ 48-day stretch in the “extreme fear” zone.
The Crypto Fear & Greed index tracks market sentiment using volatility, momentum, volume, and social data. Any reading below 25 signals extreme fear, while higher values reflect an improving risk appetite.
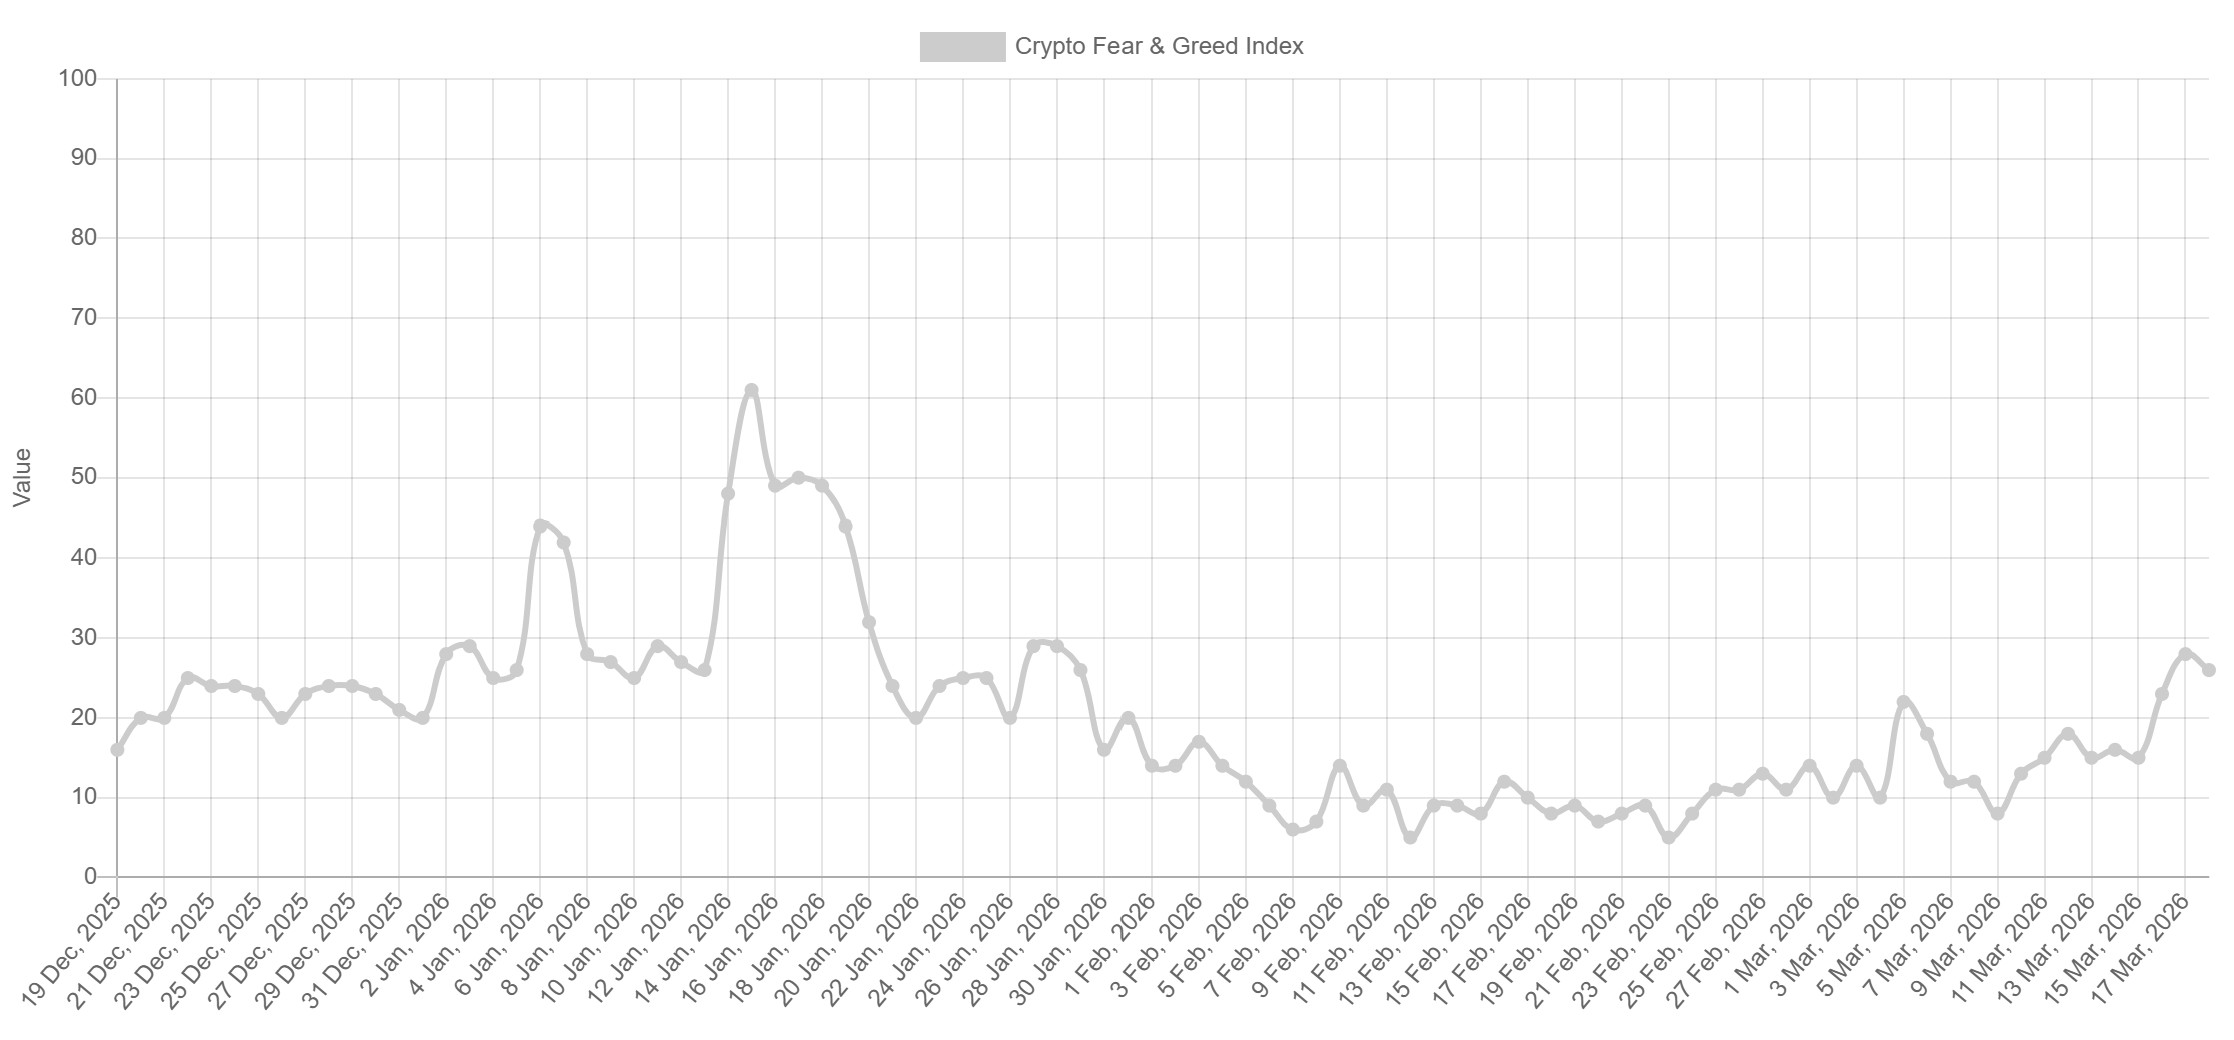
Crypto Fear & Greed Index. Source: alternative.me
The index reading points to an improvement in market sentiment this week, marking its first exit from extreme fear in over six weeks.
The move coincides with a recovery in the total crypto market capitalization, which has added 7.65% in March, equivalent to roughly $174 billion. This marks the first monthly bullish expansion since September 2025. Before this, the market declined nearly 40%, dropping to $2.28 trillion from $3.65 trillion in the previous five months.
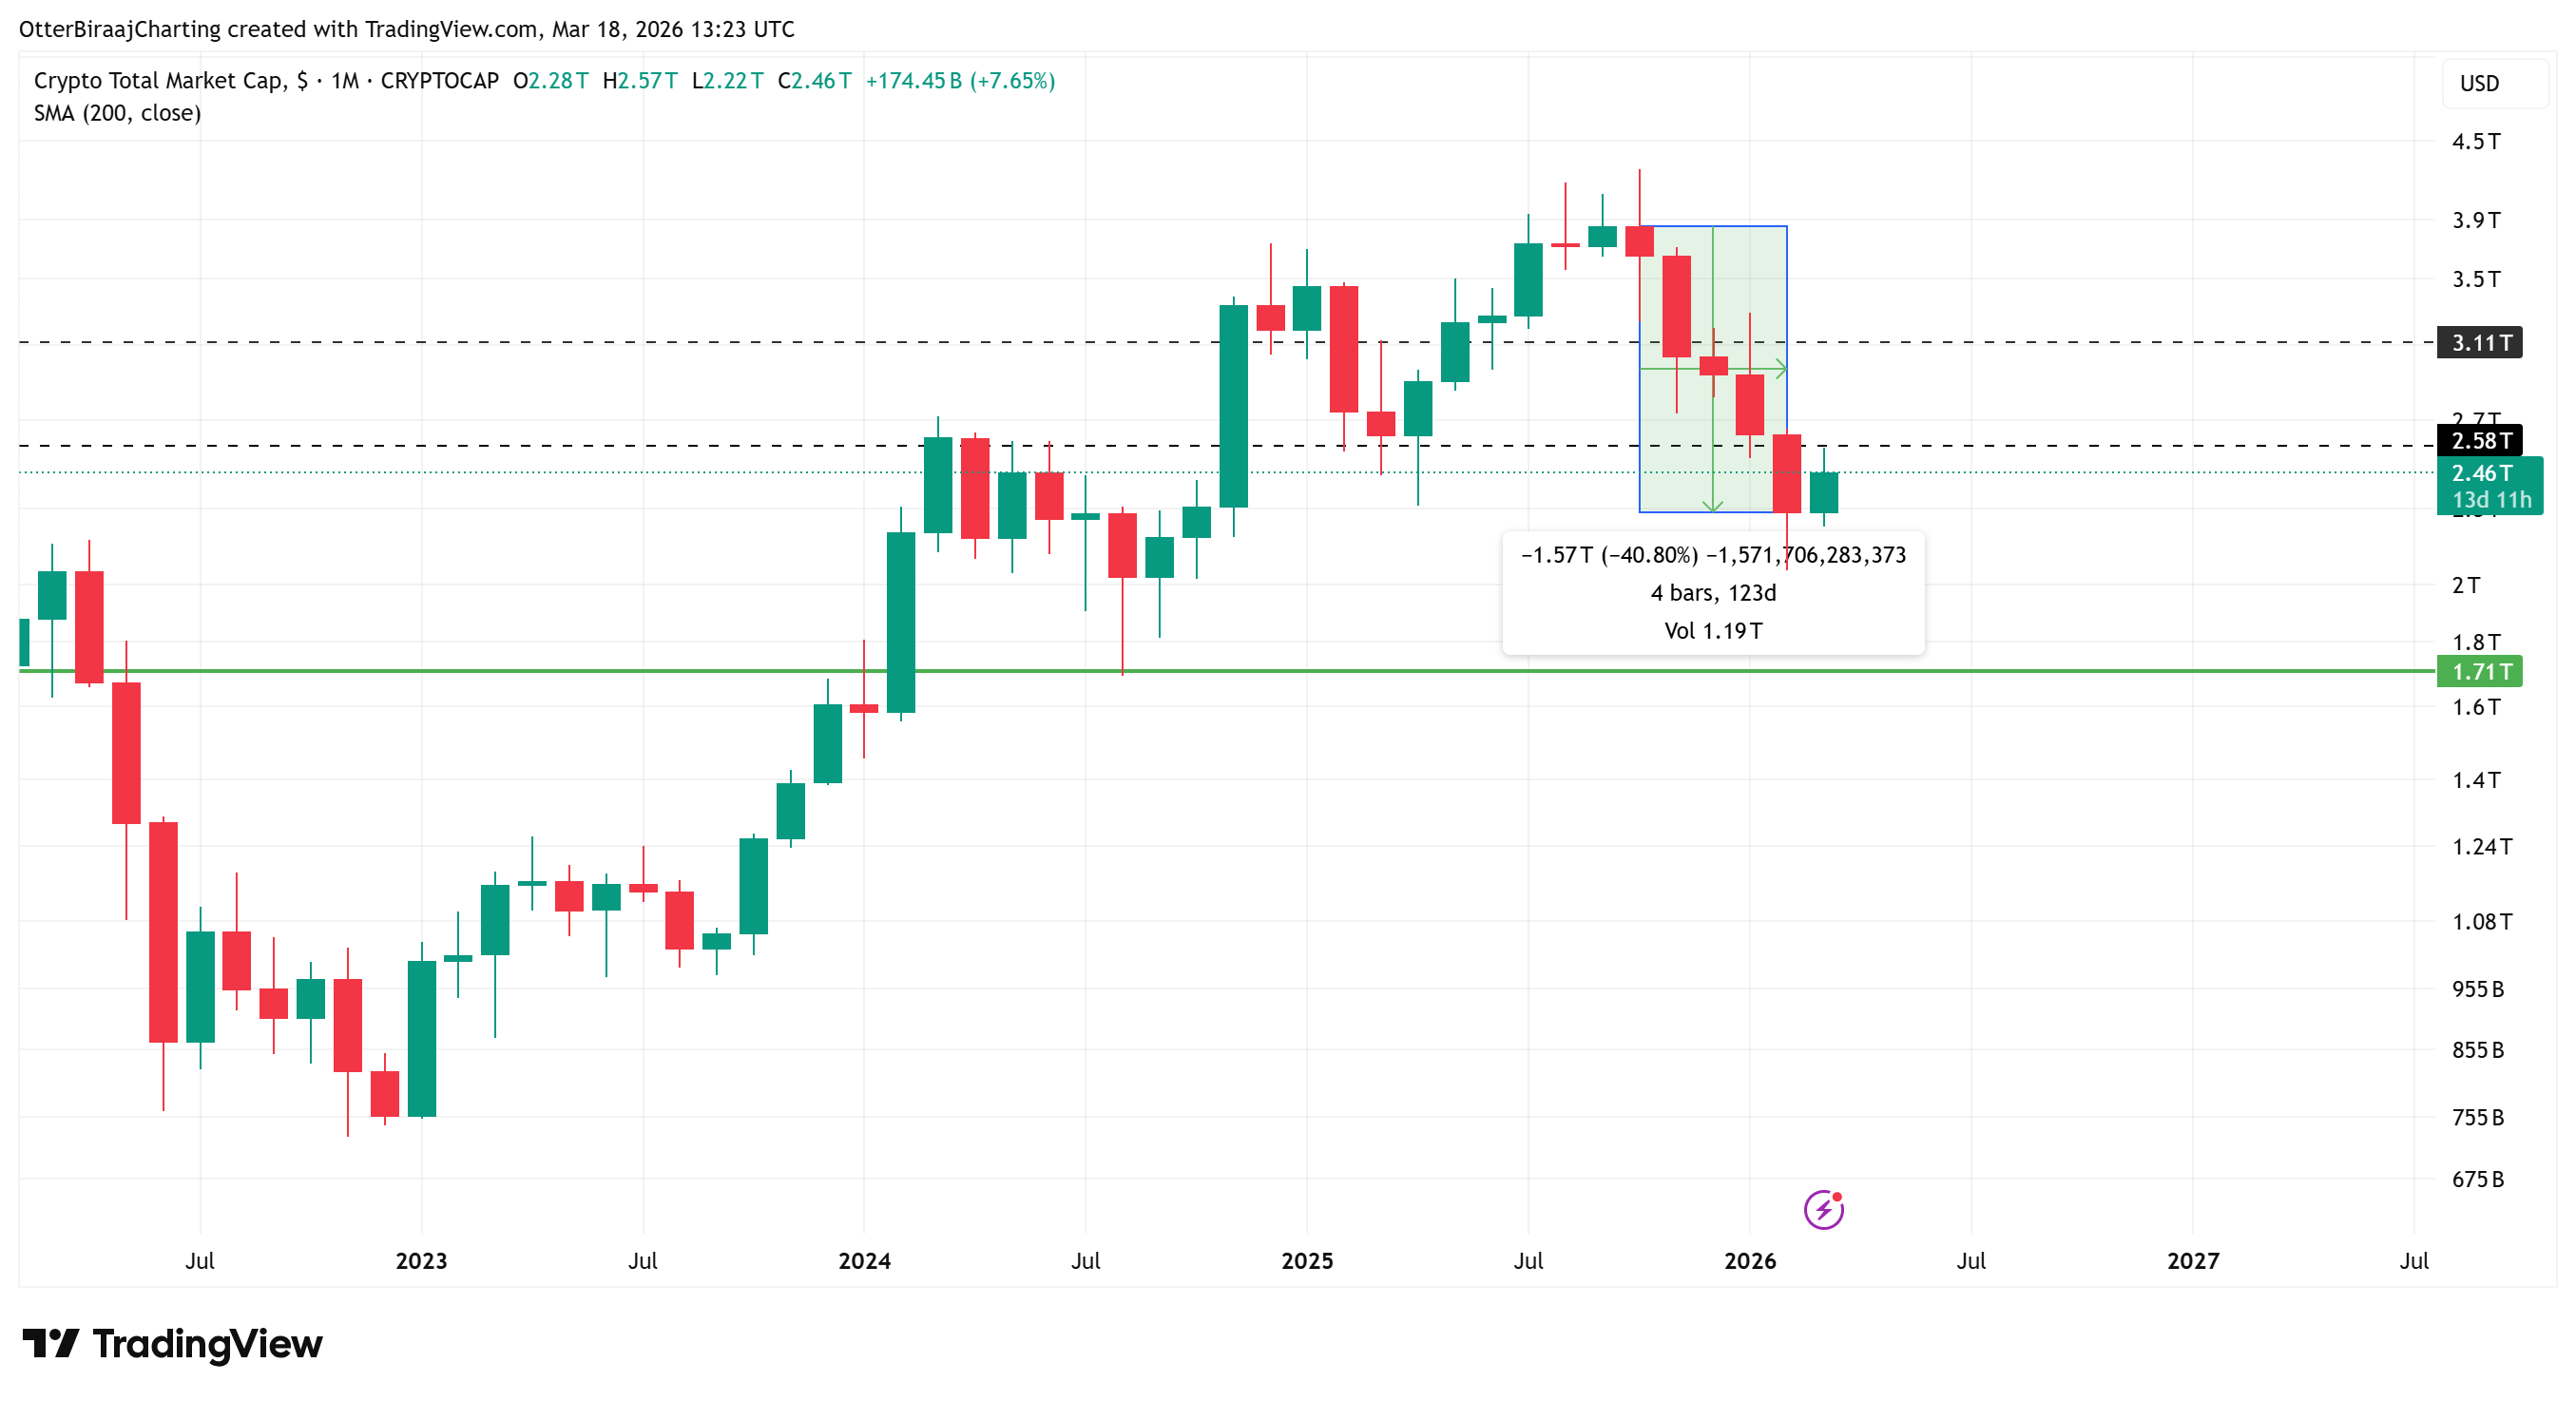
TOTAL/USD one-month chart. Source: Cointelegraph/TradingView
Market researcher Sminston With provided additional context to the Fear & Greed index.
With said that an analysis of the past Bitcoin market cycles shows that buying BTC during fear phases delivered stronger returns over a two to four-year window.
The average gains reached 331% over three years, compared to 100% for BTC entries made during the greed phases. However, over longer time periods (four to five years), the return differences narrowed, with both the entry strategies converging as Bitcoin’s long-term growth trend dominated the price action.
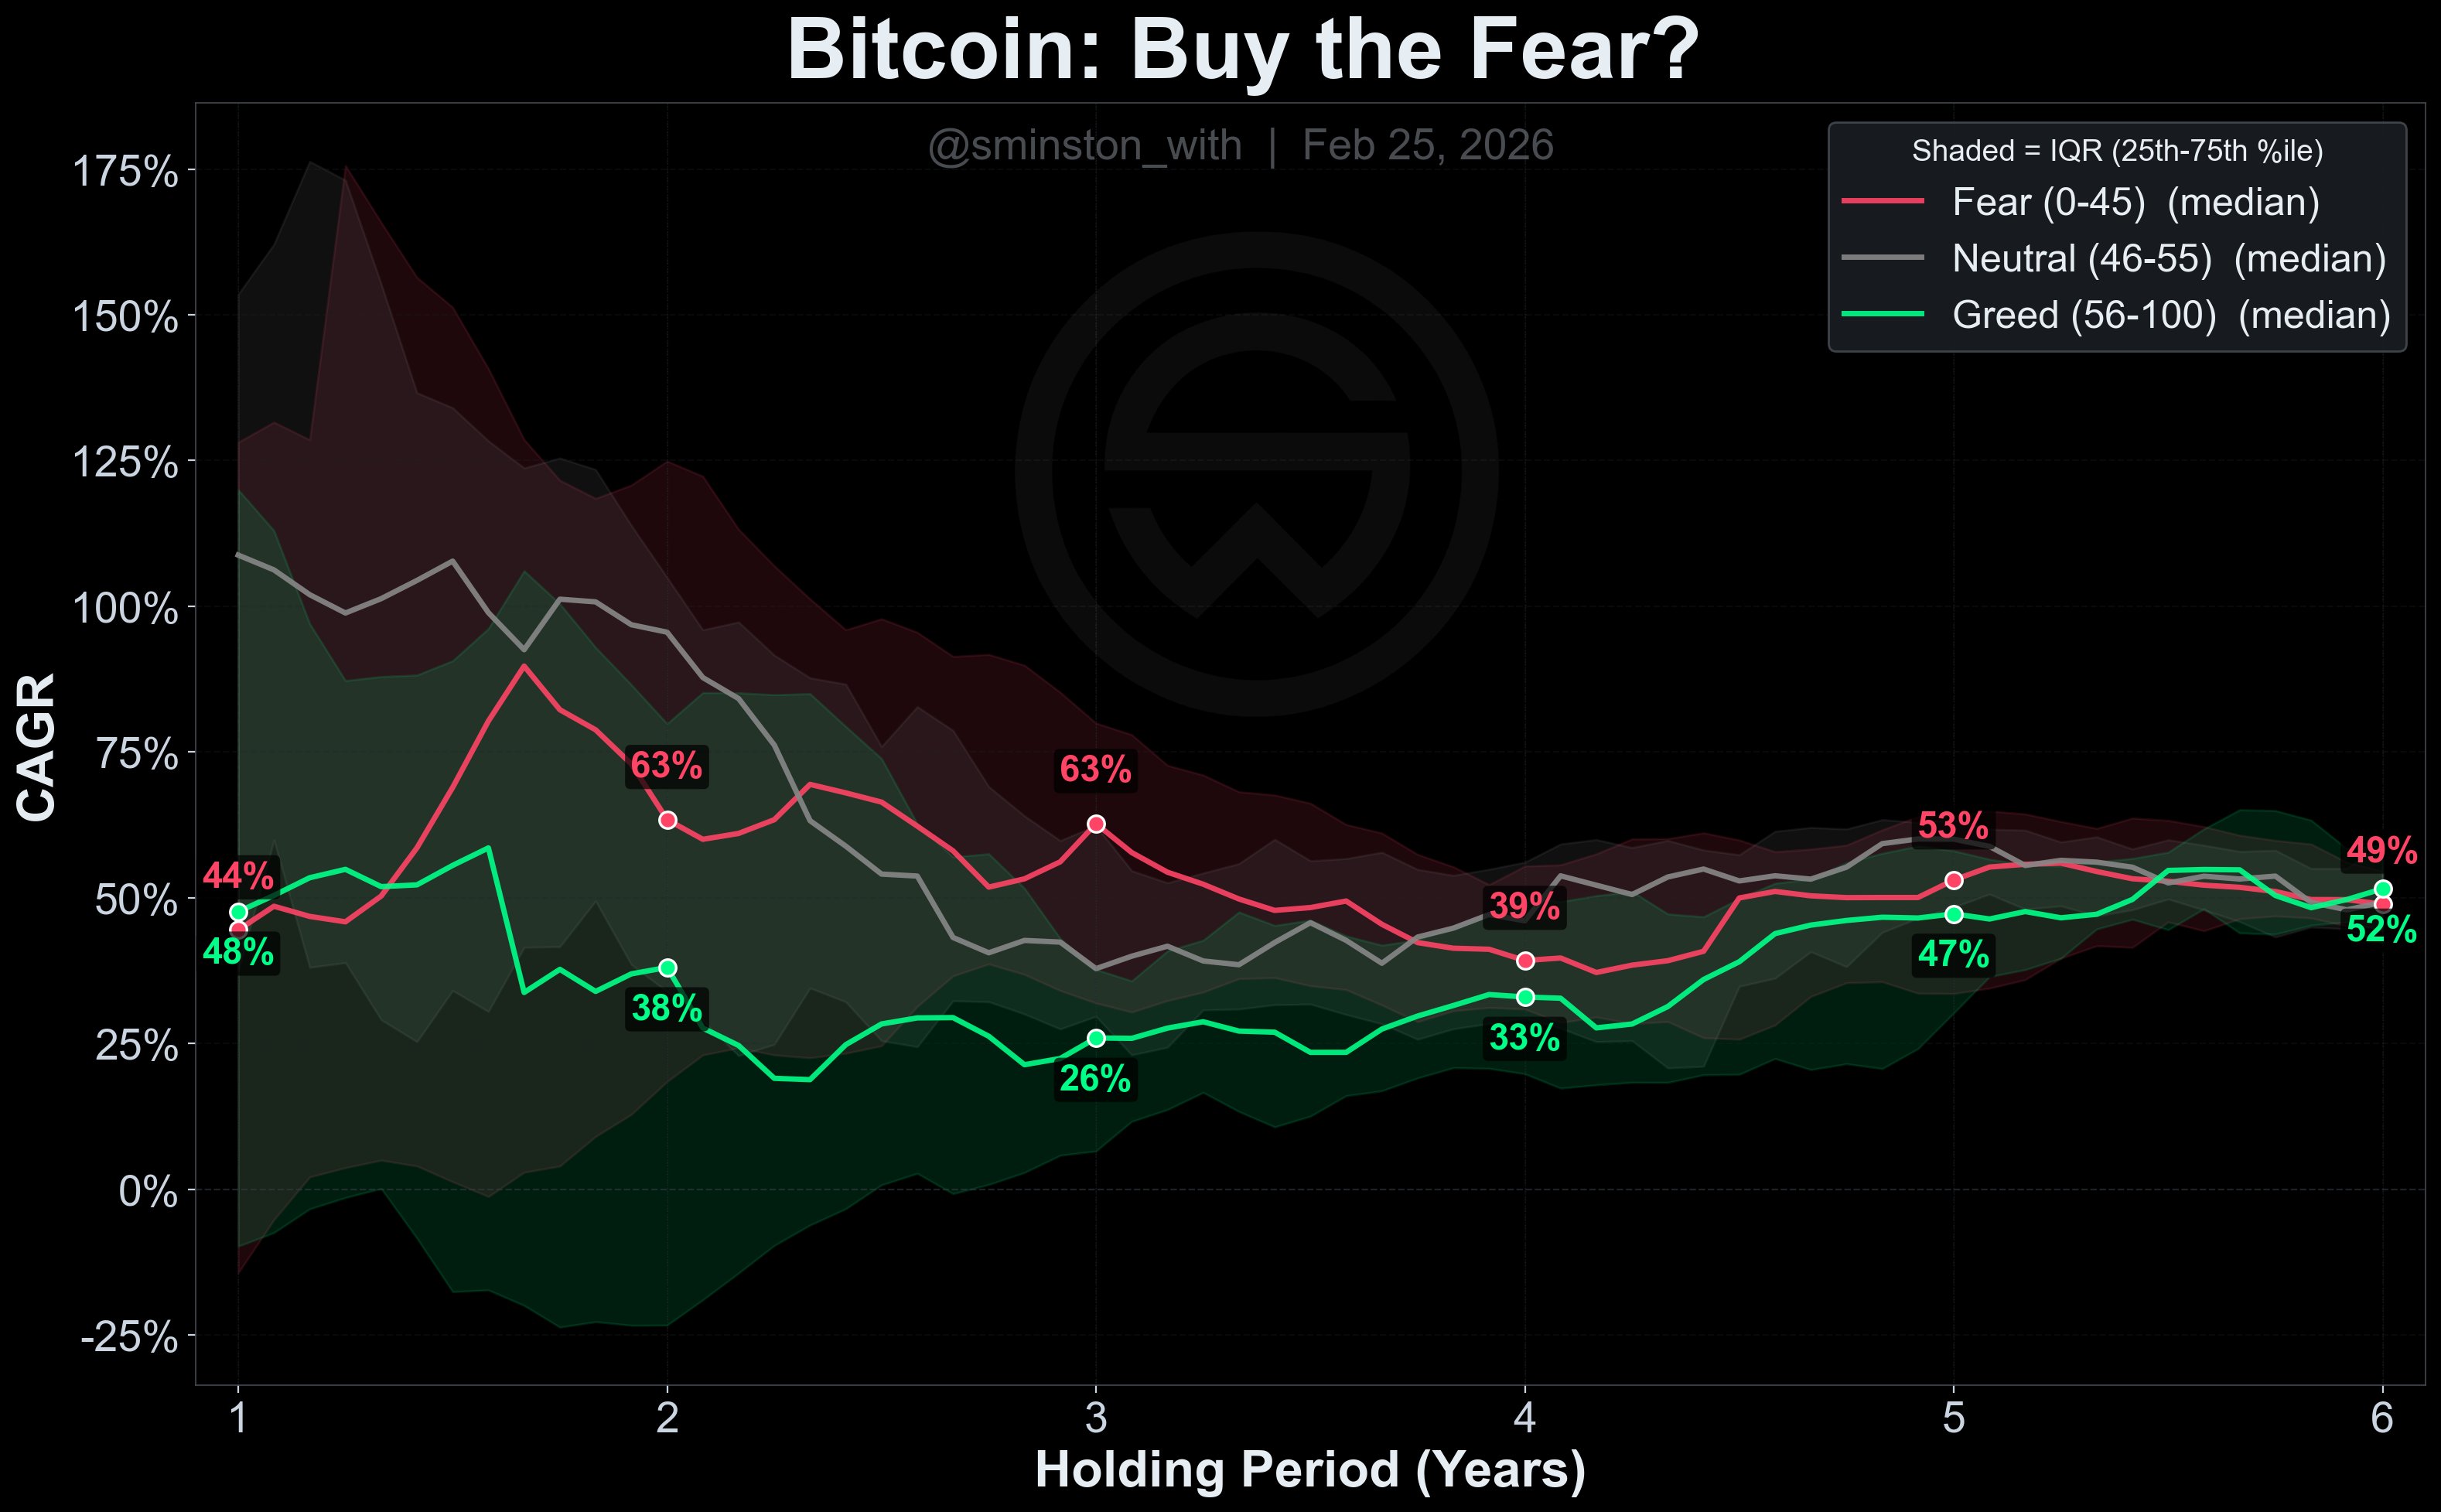
Bitcoin Fear & Greed index buy analysis. Source: Sminston With/X
Related: SOL price signal tied to previous 142% rally flashes again: Are the bulls back?
A rise in stablecoin inflows signals liquidity return
Binance exchange flow data shows a shift in capital movement. Binance recorded a $2.2 billion inflow in Tether USDt (USDT) on March 18, marking the largest single-day stablecoin deposit since November 2025.
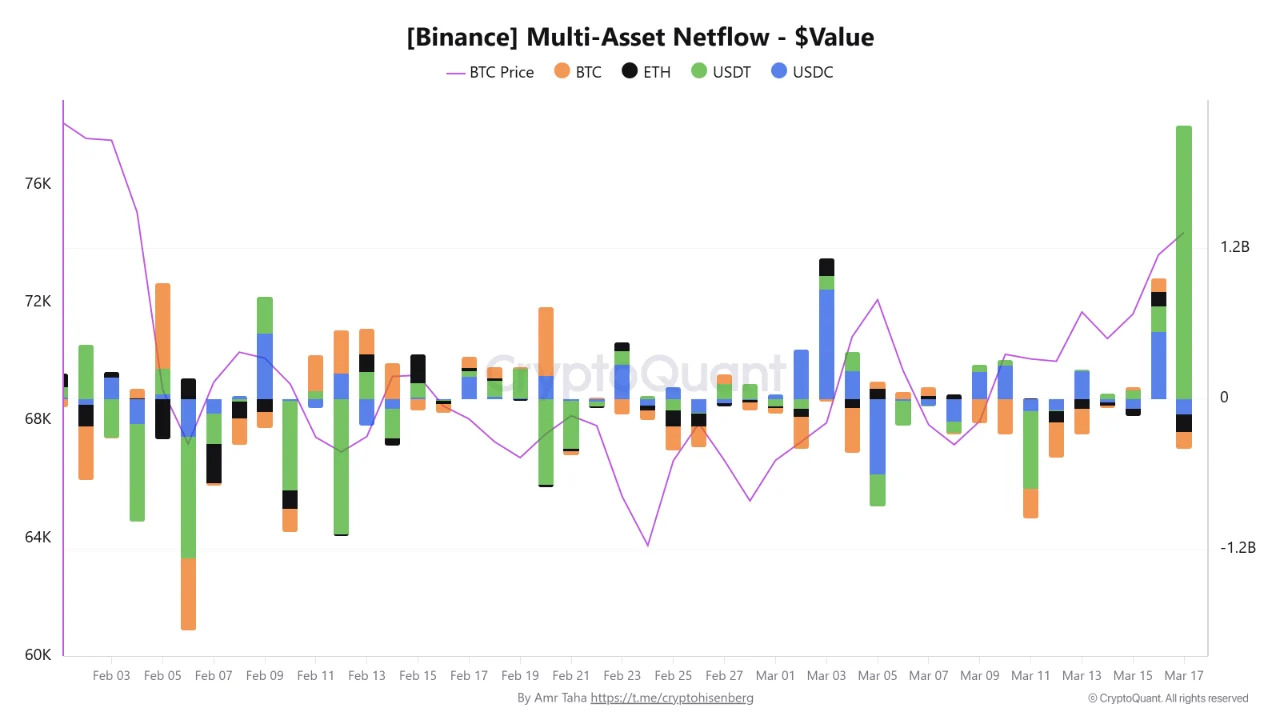
Binance multi-asset netflow. Source: CryptoQuant
These inflows represent the available capital, often referred to as “dry powder,” that can be deployed into the crypto markets. The spike coincided with Bitcoin pushing into higher price levels near $75,000 on Monday, linking the liquidity injection with active trader positioning.
Meanwhile, the total stablecoin reserves across exchanges surged to $68.5 billion from a six-month low of $64 billion on March 8, marking a sharp increase of 7%, within a short period.
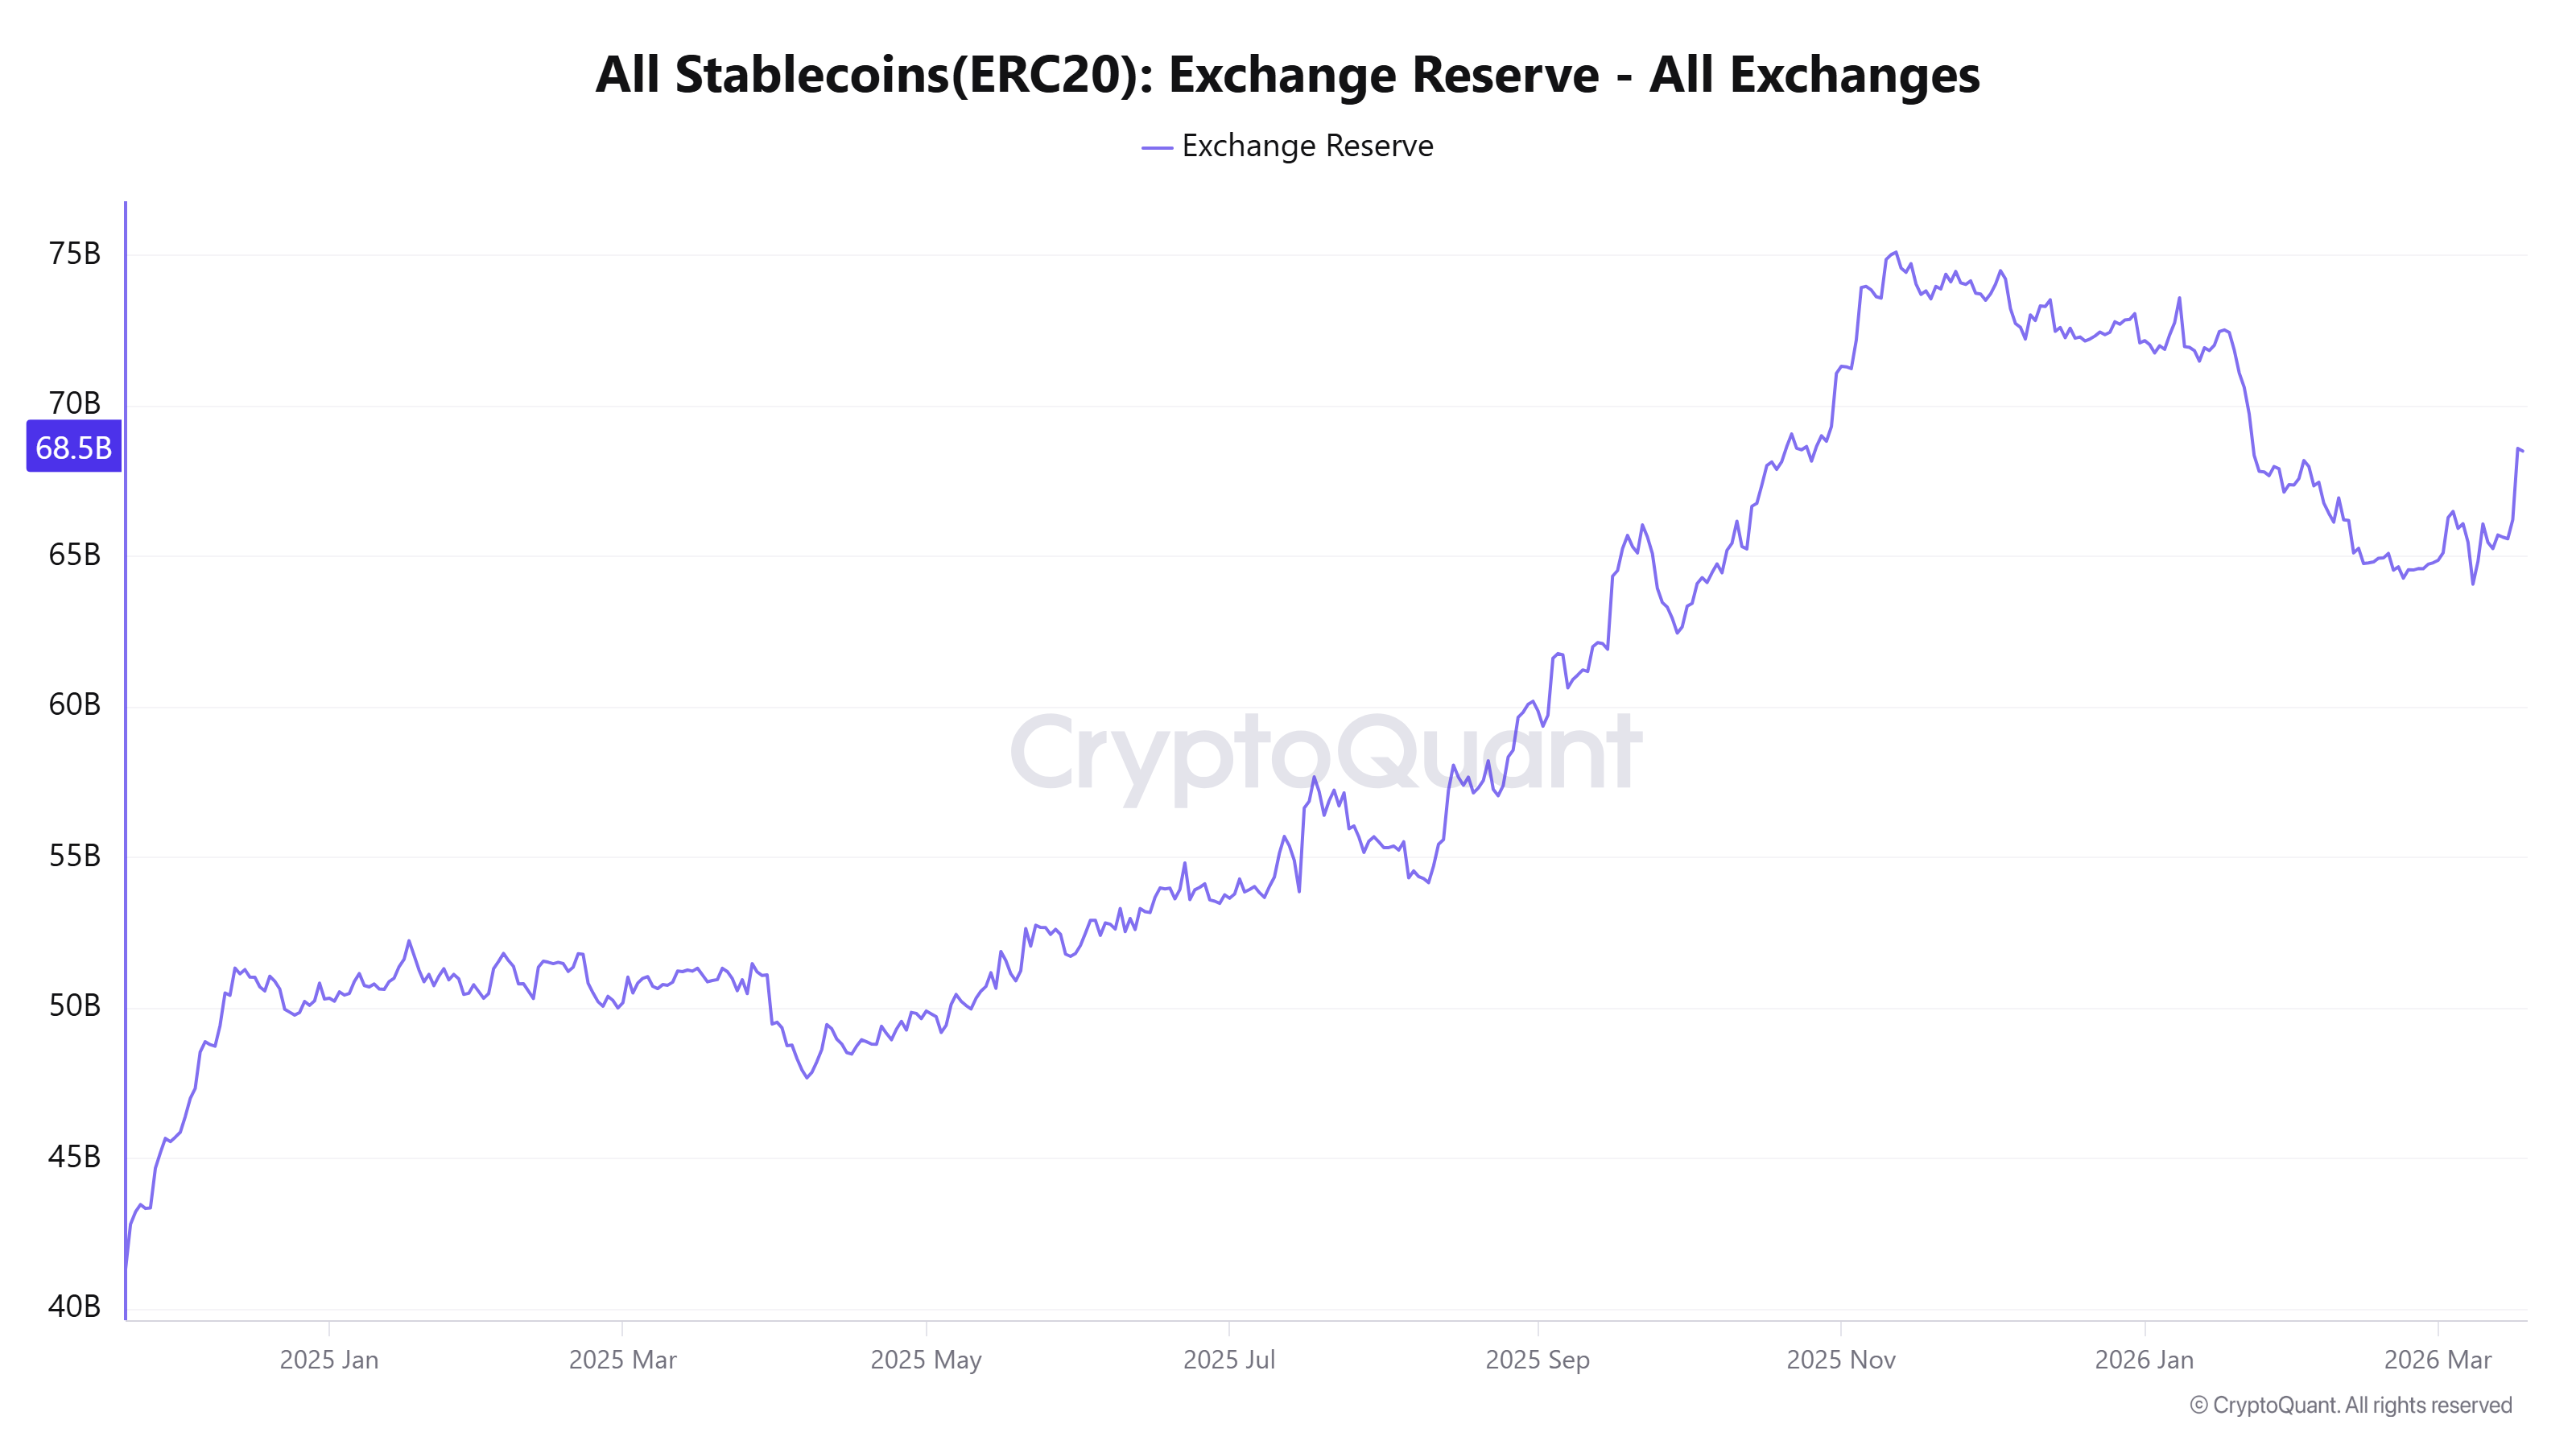
All stablecoins exchange reserves. Source: CryptoQuant
A rise in exchange-held stablecoins typically signals that participants are preparing to deploy funds into spot or derivatives markets. This indicates that traders are re-entering with the intent to take positions, adding to near-term buying capacity.
Related: Australian crypto shopping surges, but so do banking blocks: Survey


Subscribe to daily byte-sized crypto news from Cointelegraph
This article is produced in accordance with Cointelegraph's Editorial Policy and is intended for informational purposes only. It does not constitute investment advice or recommendations. All investments and trades carry risk; readers are encouraged to conduct independent research.