
Bitcoin Price is Showing 3 Textbook Technical Signs of a Severe Correction
Latest NewsPublishedApr 18, 2020
As Bitcoin consolidates in a tight $6,900 to $7,100 range three technical factors suggest BTC is vulnerable to a sharp correction.

The Bitcoin price (BTC) has been consolidating in the $6,900 to $7,100 range throughout the past 36 hours, right below a heavy resistance level at $7,200. Typically, a large price movement occurs when BTC gets stuck in a tight range for a prolonged period of time.
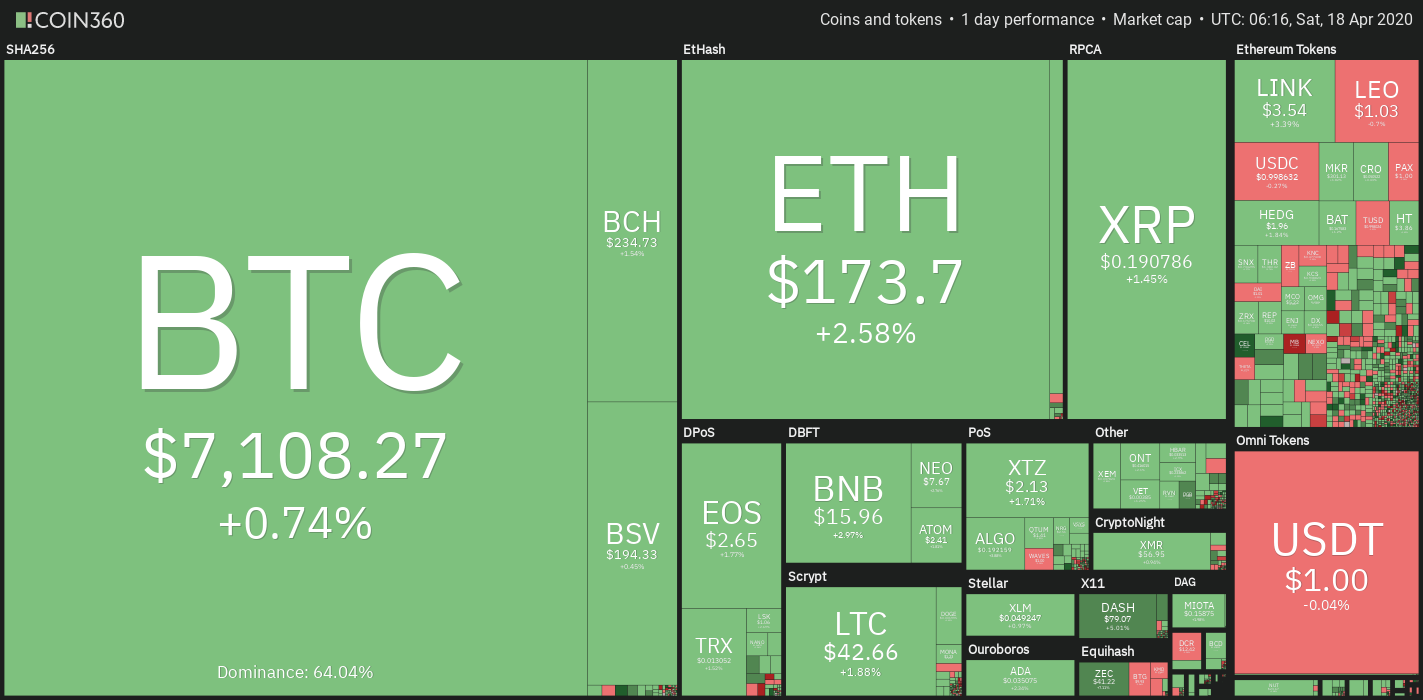
Crypto market daily performance. Source: Coin360
Currently, there are three technical factors that show Bitcoin is vulnerable to a large move down: deviation from the descending trendline, the emergence of a fractal resembling the 2019 top, and the increase of Tether supply.
Deviation from the descending trendline
Technically, when the Bitcoin price rejects off of a descending trendline, it suggests a bearish retest of lower support levels. Earlier this week, a cryptocurrency trader known as Trader XO suggested that in the near-term, the Bitcoin price could be following a descending trendline and possibly retest the month’s open.
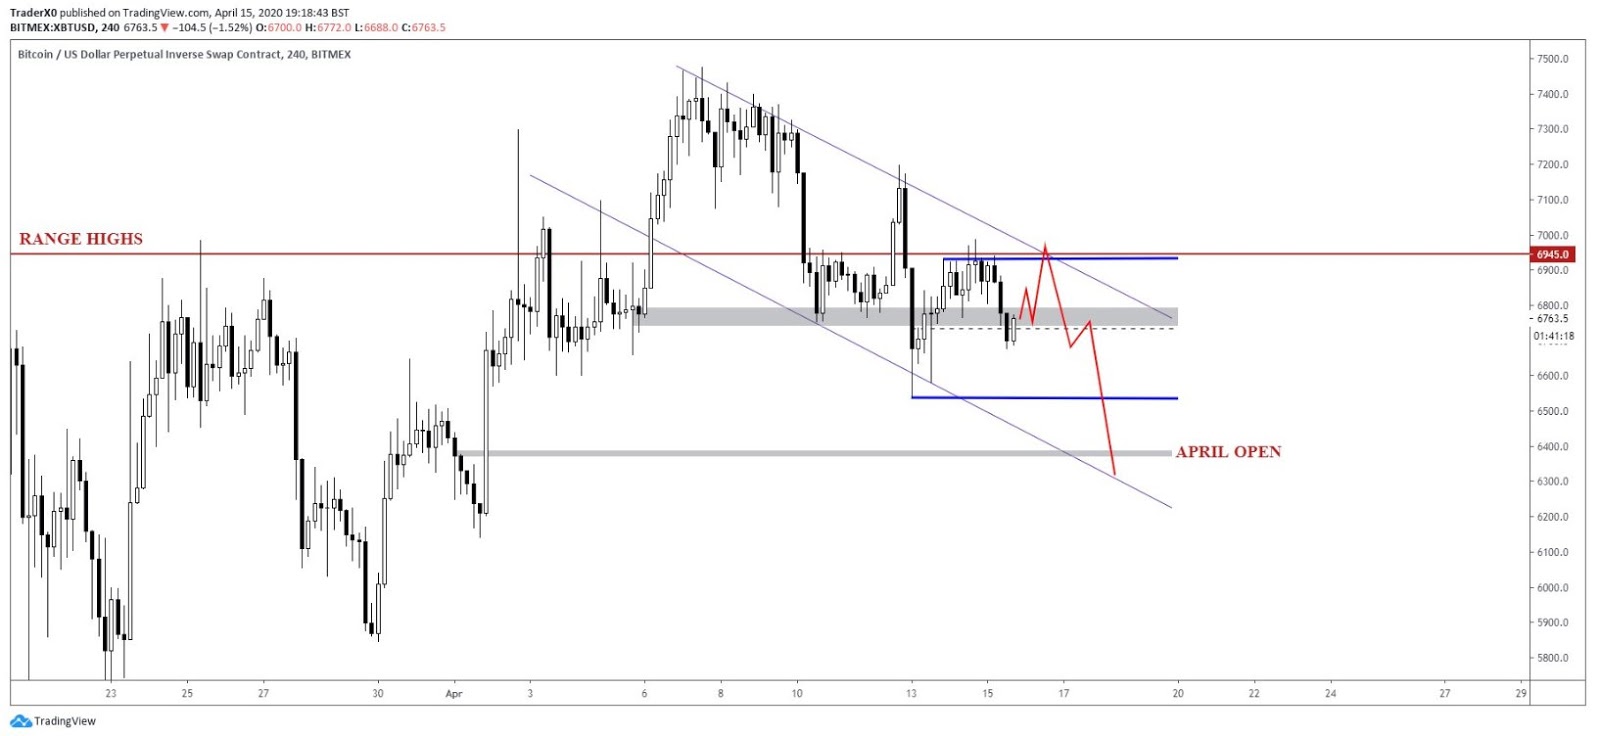
Potential Bitcoin short-term price trend. Source: Trader XO
The Bitcoin price ended up breaking out of the trendline to rise to as high as $7,200 on Coinbase, and the price of BTC is now hovering above the line at around $7,107.
But, if the BTC price rejects the $7,000 resistance level and breaks back into the previous range, the entire move would be considered a deviation and would signal a severe downtrend.
The $6,950 to $7,050 area has been an important area of resistance for Bitcoin throughout the past two weeks, and it has attempted to break out of it nine times since March 20.
Fractal mirrors the February 2020 top at $10,500
In February, before the economic consequences of the coronavirus pandemic were considered as a strong variable to the near-term trend of the Bitcoin price, BTC was showing signs of a local top at $10,500.
The price rejected at a key multi-year resistance level and in the days that followed, BTC faced a steep downtrend to $7,700, eventually dropping to as low as $3,650.
According to technical analyst, Crypto Capo, the current Bitcoin price trend is strikingly similar to the entire fractal that sent BTC from $10,500 to the $3,000s.
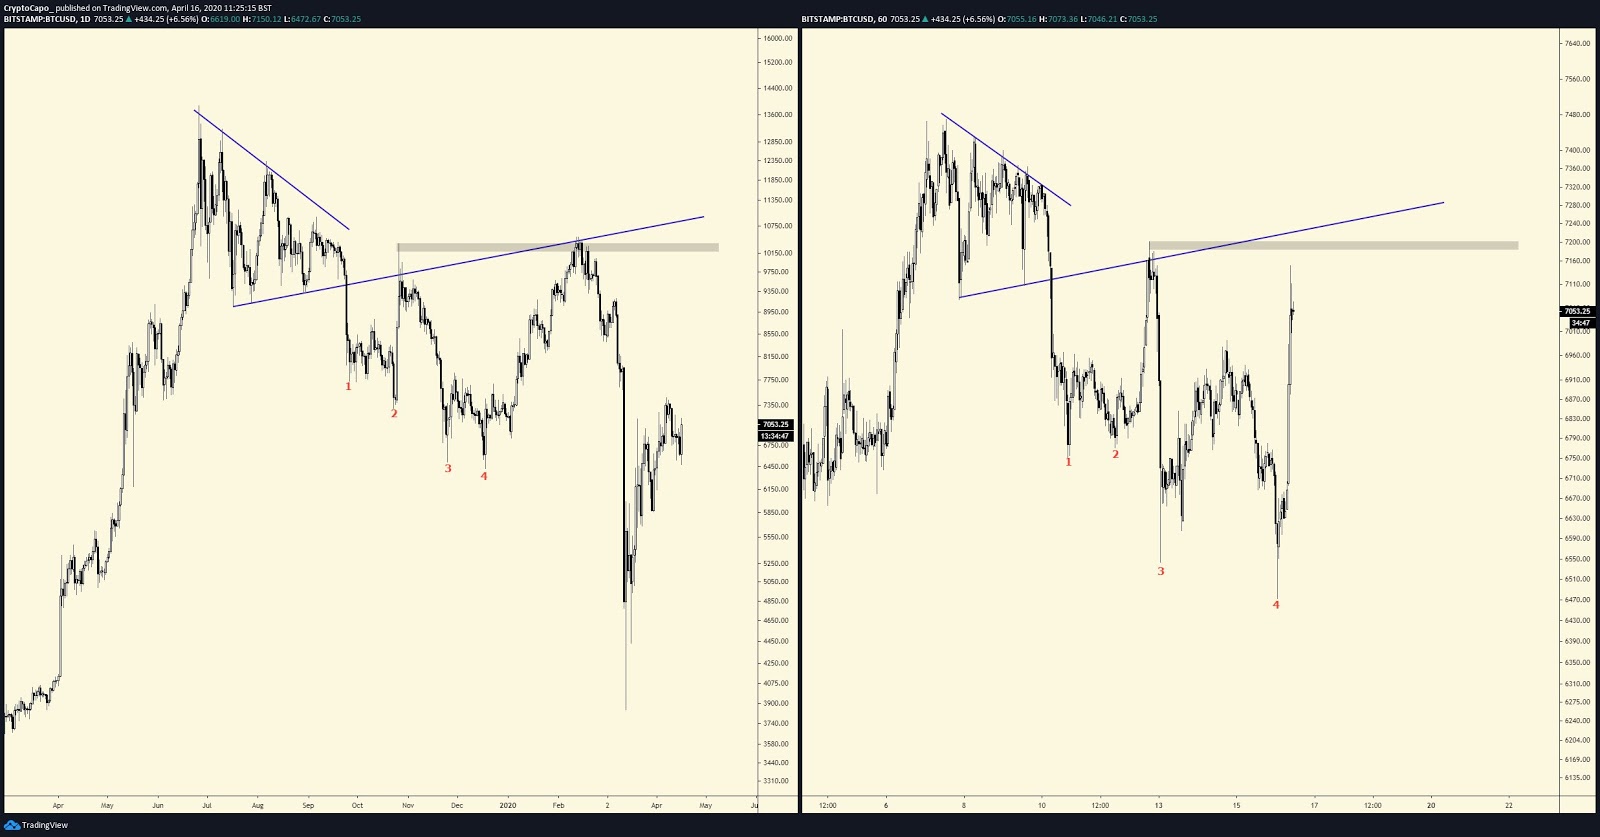
Bitcoin 2019 chart and recent 1-hour chart comparison. Source: CryptoCapo
Although the comparison is between a daily chart and a 1-hour chart, the analyst said that if the structure of the chart is the same, it is likely to see a similar outcome regardless of the timeframe.
Rising Tether supply
Throughout the past two weeks, the supply of Tether (USDT) has increased significantly by more than $2 billion, as it surpassed $6.3 billion in market capitalization.
The noticeable rise in the inflow of Tether into exchanges may indicate that the demand for the stablecoin is rising at a rapid rate, as investors seek for a safety net. In fact, a cryptocurrency investor known as Light recently said:
“Tether exchange balances ballooning as potential BTC supply available to be acquired on exchanges is falling.”
The fast growth of the Tether supply at a time wherein uncertainty shades above the cryptocurrency market could indicate that many investors remain cautious and skeptical towards the v-shape recovery of BTC since March 12.

Subscribe to daily byte-sized crypto news from Cointelegraph
Cointelegraph is committed to independent, transparent journalism. This news article is produced in accordance with Cointelegraph’s Editorial Policy and aims to provide accurate and timely information. Readers are encouraged to verify information independently.