
Asset managers and companies currently hold over 6% of Bitcoin’s (BTC) circulating supply, according to Buy Bitcoin Worldwide. A breakdown of the data shows that Bitcoin fund issuers and asset managers hold about 4%, public companies account for nearly 1% and private companies own roughly 0.83% of the cryptocurrency’s supply.
It's clear that institutional investors have continued to add crypto to their portfolios, and Adam Proctor, managing director for billionaire Simon Nixon’s investment firm — Seek Ventures — said the company plans to increase “allocation to crypto,” as it believes it to be an “important area for the future.”

CNBC Mad Money host Jim Cramer recently said that he was a “believer in crypto” and recommended that investors allocate 5% of their investment portfolio to digital currencies.
Will Bitcoin breaking above the psychological barrier at $50,000 result in a buying stampede in the sector? Let’s study the charts of the top 10 cryptocurrencies to find out.
BTC/USDT
Strong resistance near the $50,000 mark may have attracted profit-booking from the short-term traders on Aug. 26. That pulled Bitcoin below the support line of the rising wedge pattern, but the bears have not been able to capitalize on this move to sink the price below the moving averages.

The bulls pushed the price back into the wedge on Aug. 27. If the rebound sustains, the BTC/USDT pair could gradually move toward the overhead resistance zone of $50,000 to $50,500. A breakout and close above this zone will indicate the resumption of the uptrend.
The pair could then rise to the resistance line of the wedge where bears may again mount a stiff resistance. If the price turns down from this resistance, the pair may continue to rise inside the wedge.
A breakout of the wedge will signal a pick-up in momentum. That may result in a rally to $60,000.
The relative strength index (RSI) has broken below a symmetrical triangle pattern, indicating a marginal advantage to the bears. If the price turns down from the current level and breaks below the moving averages, the pair may drop to $42,451.67.
ETH/USDT
Ether (ETH) has been consolidating in a tight range between $3,000 and $3,335 for the past few days. The 20-day exponential moving average (EMA) ($3.097) is flattening out and the RSI is just above the midpoint, indicating a balance between supply and demand.

The price has rebounded off the 20-day EMA on Aug. 27, and the bulls will now attempt to push the price above $3,335. If that happens, it will suggest that bulls accumulated the ETH/USDT pair inside the range. The pair could then rally to $3,670 and later to $4,000.
A break and close below $3,000 will indicate that bears have overpowered the bulls. That could result in further selling, as several stop-losses may get hit. The pair could then drop to the next support at the 200-day simple moving average (SMA) ($2,366).
ADA/USDT
Generally, the breakout from a critical level is retested as seen in Cardano (ADA). The price dropped from an all-time high at $2.97 on Aug. 23 to the breakout level at $2.47 on Aug. 26.

The ADA/USDT pair rebounded off the breakout level of $2.47 on Aug. 27, indicating that the sentiment remains positive and traders are buying on every minor dip. The bulls will make one more attempt to push the price above the overhead resistance at $2.97.
If they succeed, the pair may rally to $3.50. The upsloping 20-day EMA ($2.29) and the RSI in the overbought zone suggest an advantage to buyers.
Conversely, if the price turns down from the current level or the overhead resistance, it will indicate that bulls are closing their positions on rallies. A break and close below the 20-day EMA will signal the start of a deeper correction.
BNB/USDT
Binance Coin’s (BNB) intraday high on May 19 was $516.50, and that level is likely to act as a stiff resistance. The bulls pushed the price above this resistance on Aug. 26 but could not sustain the altcoin above it.

If buyers do not give up much ground from the current levels, it will suggest strength. The bulls will then make one more attempt to clear the overhead hurdle. If they can pull it off, the BNB/USDT pair may rally to $600.
The rising 20-day EMA ($432) and the RSI in the positive zone suggest an advantage to buyers. This positive view will invalidate if the price turns down and breaks below the 20-day EMA. That could result in a decline to the 200-day simple moving average ($362).
XRP/USDT
Ripple (XRP) has again dropped to the breakout level at $1.07. This is an important level for the bulls to defend because if it cracks, the altcoin could witness a long liquidation and drop to the next support at the 200-day SMA ($0.86).

The flattening 20-day EMA ($1.08) and the RSI just above the midpoint suggest that bulls may be losing their grip.
If the price rebounds off the current level, the XRP/USDT pair could rise to the downtrend line. A breakout and close above the downtrend line will increase the possibility of a rally to the overhead resistance at $1.66.
On the other hand, if the price once again turns down from the downtrend line, the pair may be at a greater risk of starting a deeper correction.
DOGE/USDT
Dogecoin (DOGE) broke below the 20-day EMA ($0.28) on Aug. 27, indicating that supply exceeds demand. The bulls are currently attempting to push the price back above the overhead resistance at $0.29.

If the DOGE/USDT pair breaks out of the downtrend line, the bullish momentum may pick up. The pair could then rise to $0.35, and if this level is crossed, the next move could be to the overhead resistance at $0.45.
On the contrary, if the price turns down from the current level, it will suggest that bears are aggressively defending at $0.29. The pair could then drop to $0.21. A strong rebound off this support could keep the pair range-bound between $0.21 and $0.29 for a few days.
DOT/USDT
Polkadot (DOT) turned down from the overhead resistance at $28.60 and corrected to the 20-day EMA ($24.03). The strong rebound off this level shows that bulls are accumulating on dips.
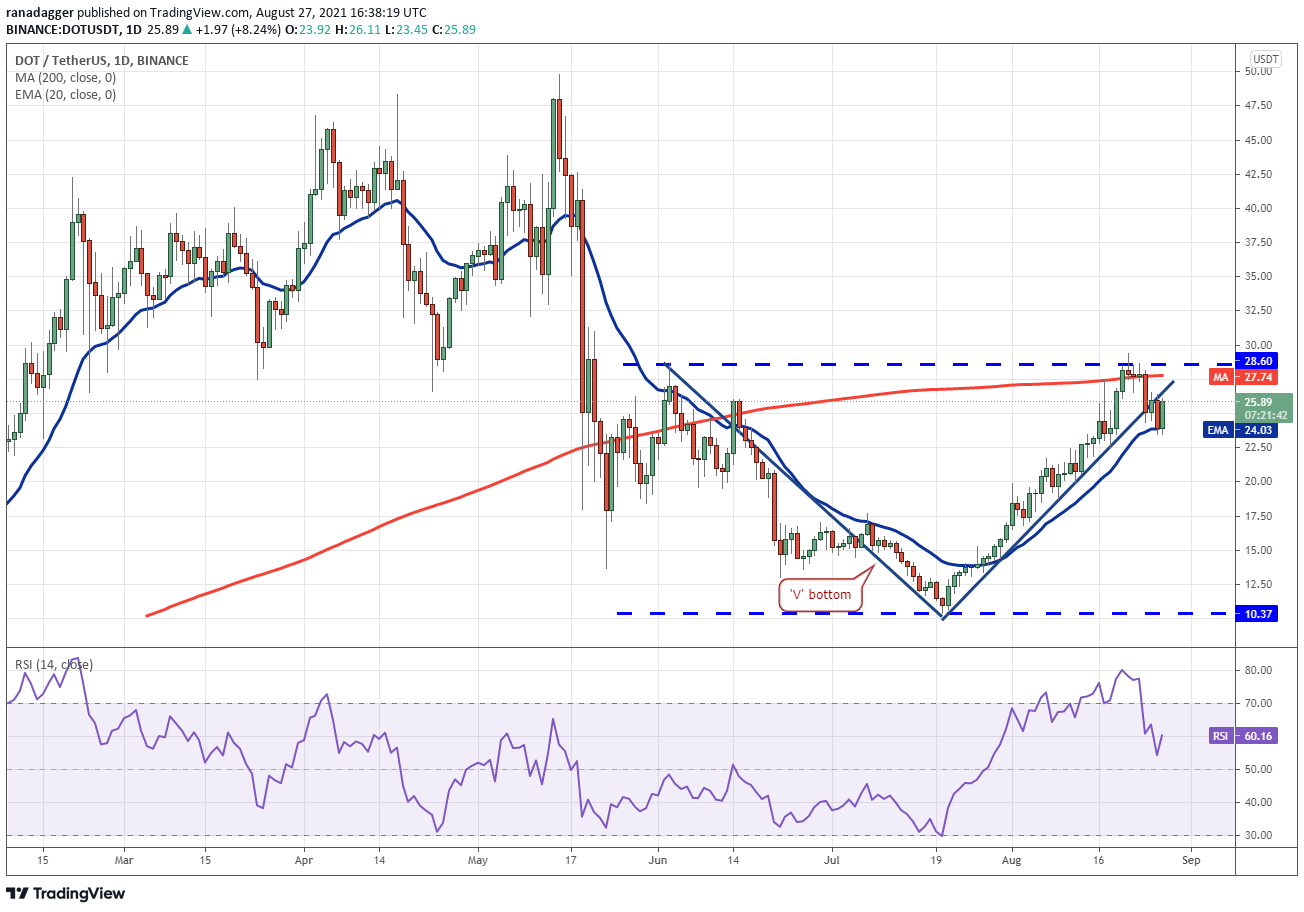
If the bounce holds up, the bulls will try to drive the price above the overhead resistance at $28.60. If the DOT/USDT pair sustains above $28.60, it will complete a V-bottom, which has a target objective at $46.83.
Alternatively, if the bounce fizzles out, the bears will try to sink the price below the 20-day EMA. If that happens, the pair may decline to the next strong support at $18. If the price rebounds off this level, the pair may remain range-bound between $18 and $28.60 for a few days.
SOL/USDT
The long tail on Solana’s (SOL) Aug. 25 and 26 candlestick shows strong buying at lower levels. A shallow correction after a strong up-move is a sign of strength because it suggests that traders are not closing their positions and are buying on minor dips.
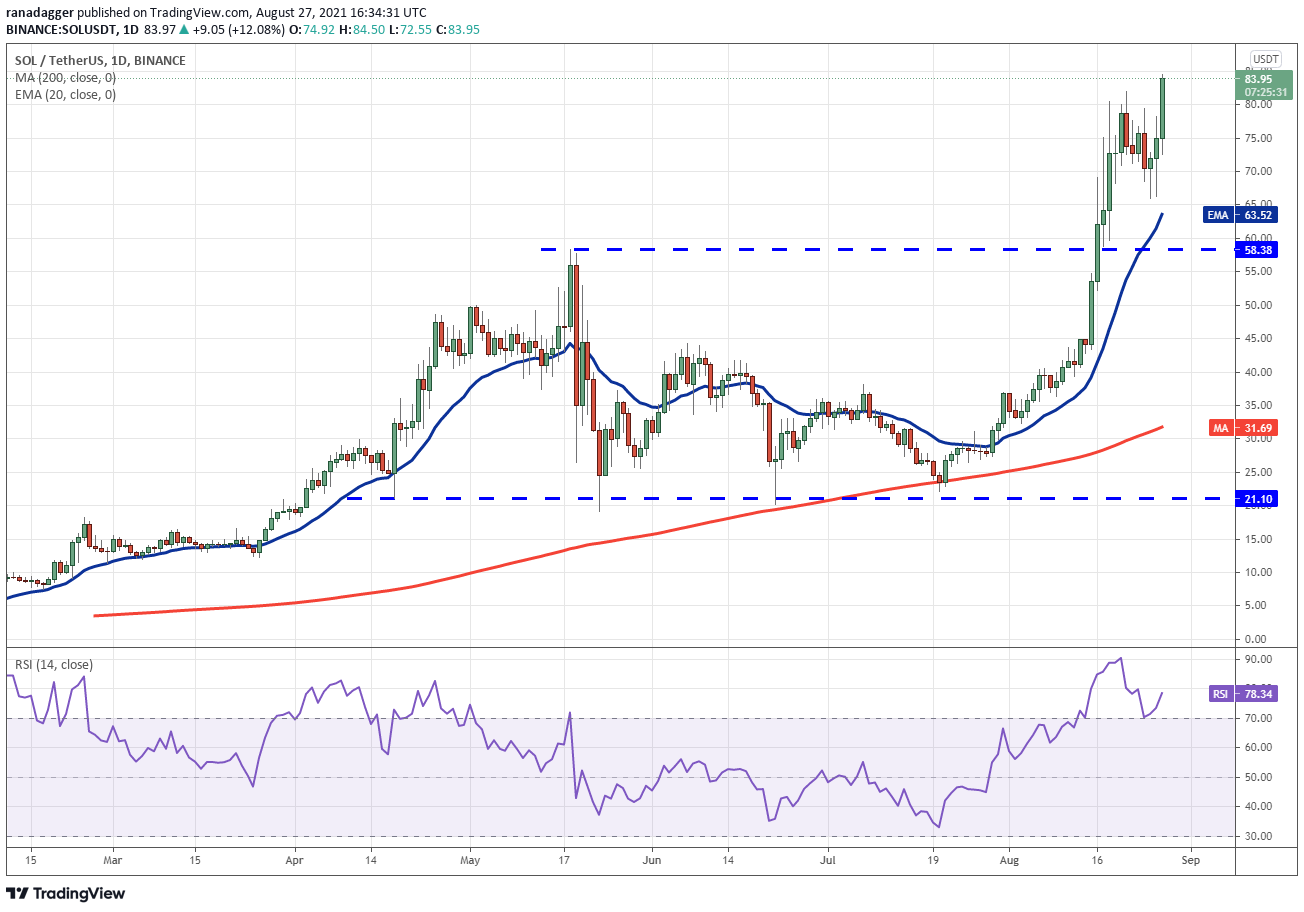
The bulls pushed the price above the all-time high at $82 on Aug. 27. If buyers sustain the price above $82, the SOL/USDT pair could start its journey toward the next psychological barrier at $100.
The rising 20-day EMA ($63) and the RSI in the overbought zone suggest that bulls are in control. If the price fails to sustain above $82, the pair could remain stuck in a range for a few days. The bears will have to pull the price below $58.38 to break the bullish momentum.
Related: Bitcoin could hit $30K or $100K this year as analyst warns ‘next months are key’
UNI/USDT
Uniswap (UNI) broke below the moving averages on Aug. 24, indicating weakness. The bulls tried to push the price back above the moving averages on Aug. 25 and 26, but they could not sustain the higher levels.

The bulls are again trying to push the price above the moving averages. If they manage to do that, the UNI/USDT pair could rally to $30. A breakout of the $30 to $31.25 overhead resistance zone could signal the start of a new uptrend.
Conversely, if the price turns down from the moving averages, the UNI/USDT pair could drop to the critical support at $23.45. A strong rebound off this level may keep the pair range-bound between $23.45 and $30 in the short term. The flat moving averages and the RSI near the midpoint also suggest a consolidation for a few days.
LUNA/USDT
Terra protocol’s LUNA token has been consolidating between $26 and $32 for the past few days. Although bulls pushed the price above $32 on Aug. 19 and 24, they could not sustain the higher levels.

The LUNA/USDT pair rebounded off the support on Aug. 27, and the bulls will again try to resume the uptrend. If the price closes above the $32 to $34.67 resistance zone, the pair may rally to $43.
The rising 20-day EMA ($24.44) and the RSI in the overbought territory suggest that the path of least resistance is to the upside. This bullish view will be negated if the price turns down from the current level or the overhead resistance and breaks below the breakout level at $22.40.
The views and opinions expressed here are solely those of the author and do not necessarily reflect the views of Cointelegraph. Every investment and trading move involves risk. You should conduct your own research when making a decision.
Market data is provided by HitBTC exchange.
This article does not contain investment advice or recommendations. Every investment and trading move involves risk, and readers should conduct their own research when making a decision. While we strive to provide accurate and timely information, Cointelegraph does not guarantee the accuracy, completeness, or reliability of any information in this article. This article may contain forward-looking statements that are subject to risks and uncertainties. Cointelegraph will not be liable for any loss or damage arising from your reliance on this information.
