
XRP price risks 50% drop despite 9-day ETF inflow streak
MarketsPublishedMay 19, 2026
Spot XRP ETFs record net inflows for nine days, absorbing sell pressure and potentially supporting an XRP price recovery over time.
XRP (XRP) has fallen 12% over the last five days, and the confirmation of a bearish pattern now points to the risk of more losses ahead.
Key takeaways:
- XRP/USD’s bear pennant pattern on the three-day chart points to a possible 52.5% drop toward $0.65.
- Persistent institutional demand through exchange-traded products supports the case for a recovery in XRP price.
XRP’s descending triangle breakdown is underway
Since early February, the XRP/USD pair has been consolidating inside a bear pennant on the three-day chart.
In technical analysis, bear pennants are typically viewed as bearish continuation patterns. The pattern was confirmed when the price produced broke below the pennant’s lower trend line at $1.40, as shown in the chart below.
Related: JPMorgan lifts Bitcoin ETF exposure in Q1, led by BlackRock’s IBIT
The downside target is derived by taking the height of the initial drop (the pennant’s post) and placing it lower from the point where the price breaks below the pattern’s lower trend line.
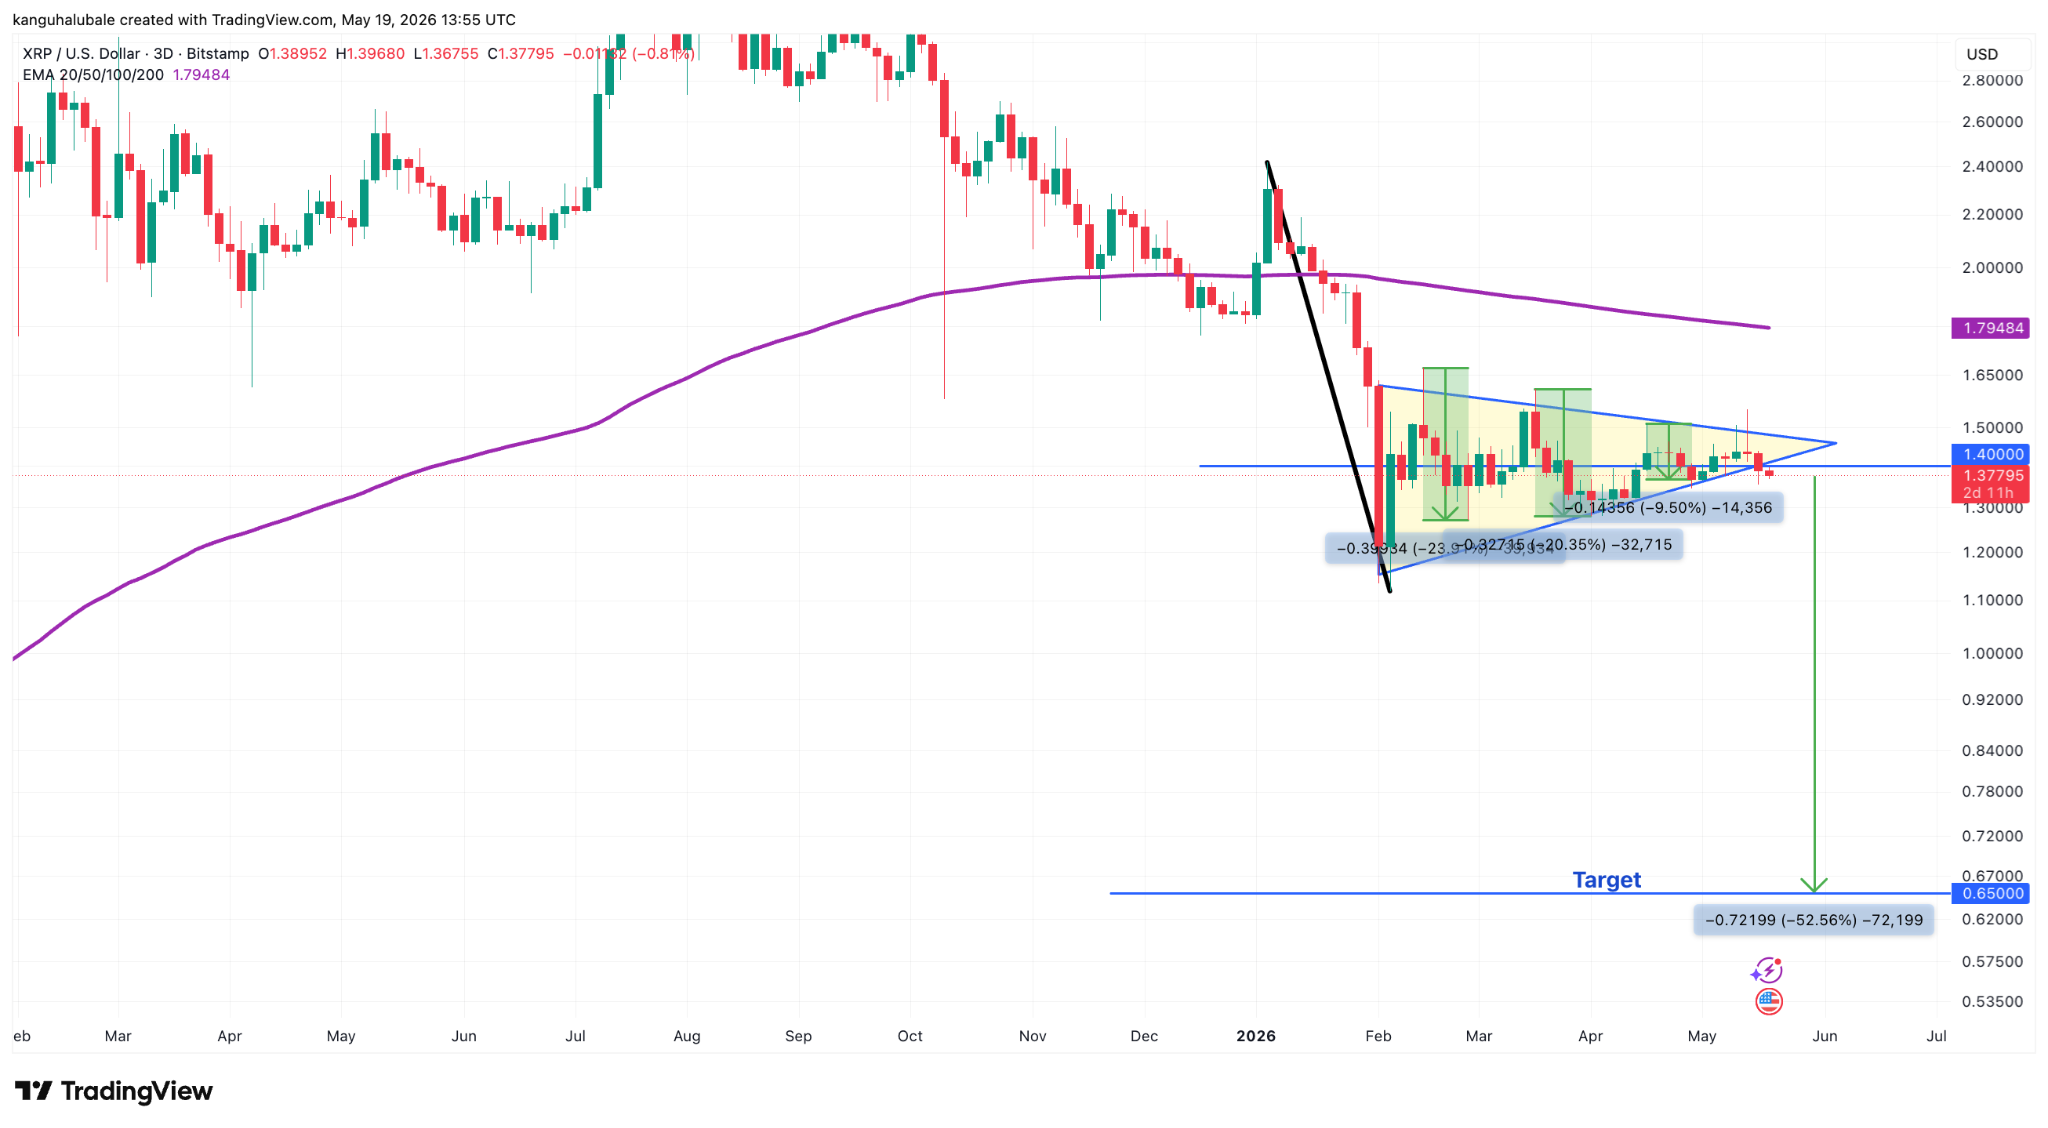
XRP/USD three-day chart. Source: Cointelegraph/TradingView,
XRP’s measured downside target comes in near $0.65, about 52.5% below current levels.
XRP’s Stoch RSI on the weekly chart “has confirmed a deathcross, marking the third time this signal has flashed since the July‑2025 ATH,” technical analyst ChartNerd said in a recent post on X.
The previous two crosses produced deeper corrections of about 50%, and the one in January came after a “relief rally into a weekly 20/50 EMA death cross,” the analyst said, adding:
“A failure at the weekly 20 (just retested) or the weekly 50 ($1.80) will likely open the next leg down later in the year.”
XRP/USD weekly chart. Source: X/ChartNerd
The daily RSI has dropped to 42 from 63 over the last seven days, suggesting increasing bearish momentum.
As Cointelegraph reported, buyers are expected to aggressively defend the $1.27 as a close below it may sink the XRP/USDT pair to $1.11 and later to the psychological level at $1.
XRP price shuns ETF demand
The five-day price correction comes even as institutional sentiment remains relatively positive, as reflected in steady inflows into US-based XRP spot ETFs.
According to data from SoSoValue, XRP ETFs added $750,000 on Monday. This marked nine consecutive days of net inflows, totaling $95.5 million. This streak has pushed cumulative inflows to nearly $1.4 billion and assets under management (AUM) to $1.14 billion.
Spot XRP ETF flows chart. Source: SoSoValue
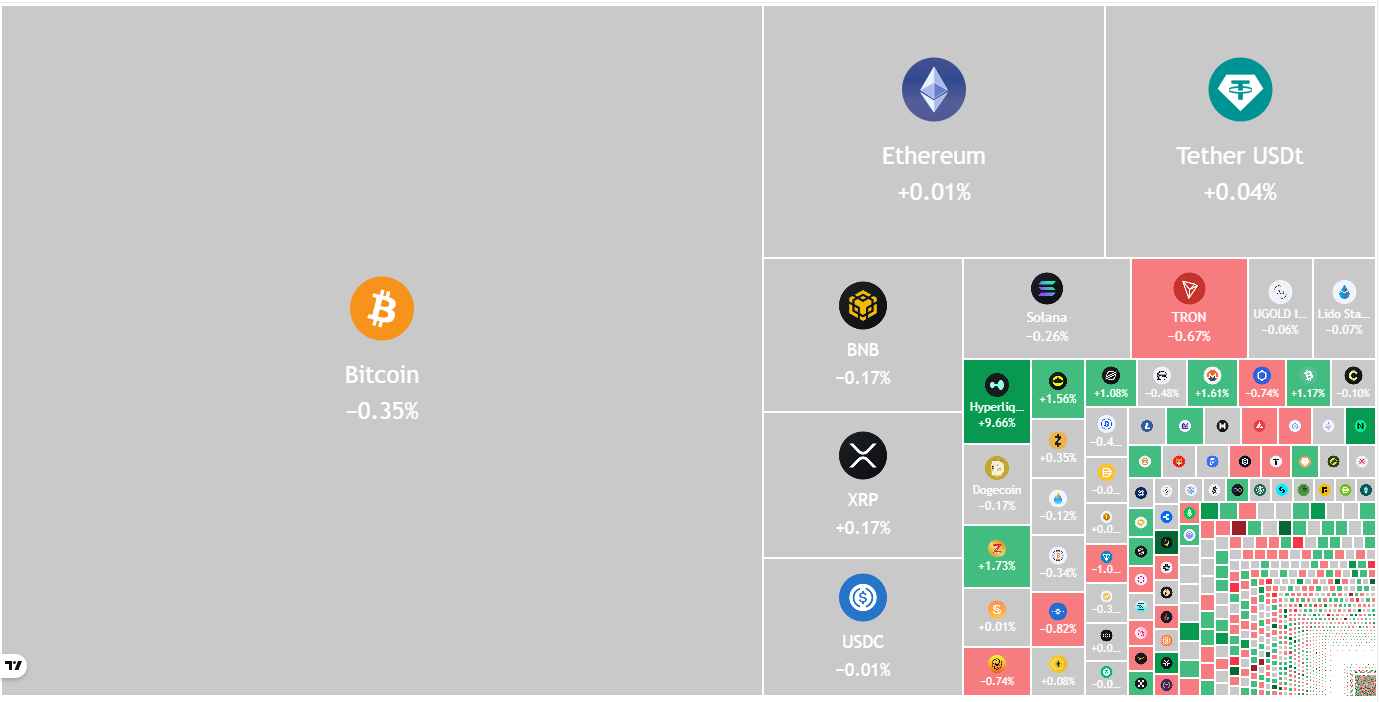
Global XRP investment products also registered weekly inflows of approximately $67.6 million during the week ending May 15, outperforming Bitcoin (BTC) and Ether (ETH), which saw $981.5 million and $250 million in outflows, respectively.
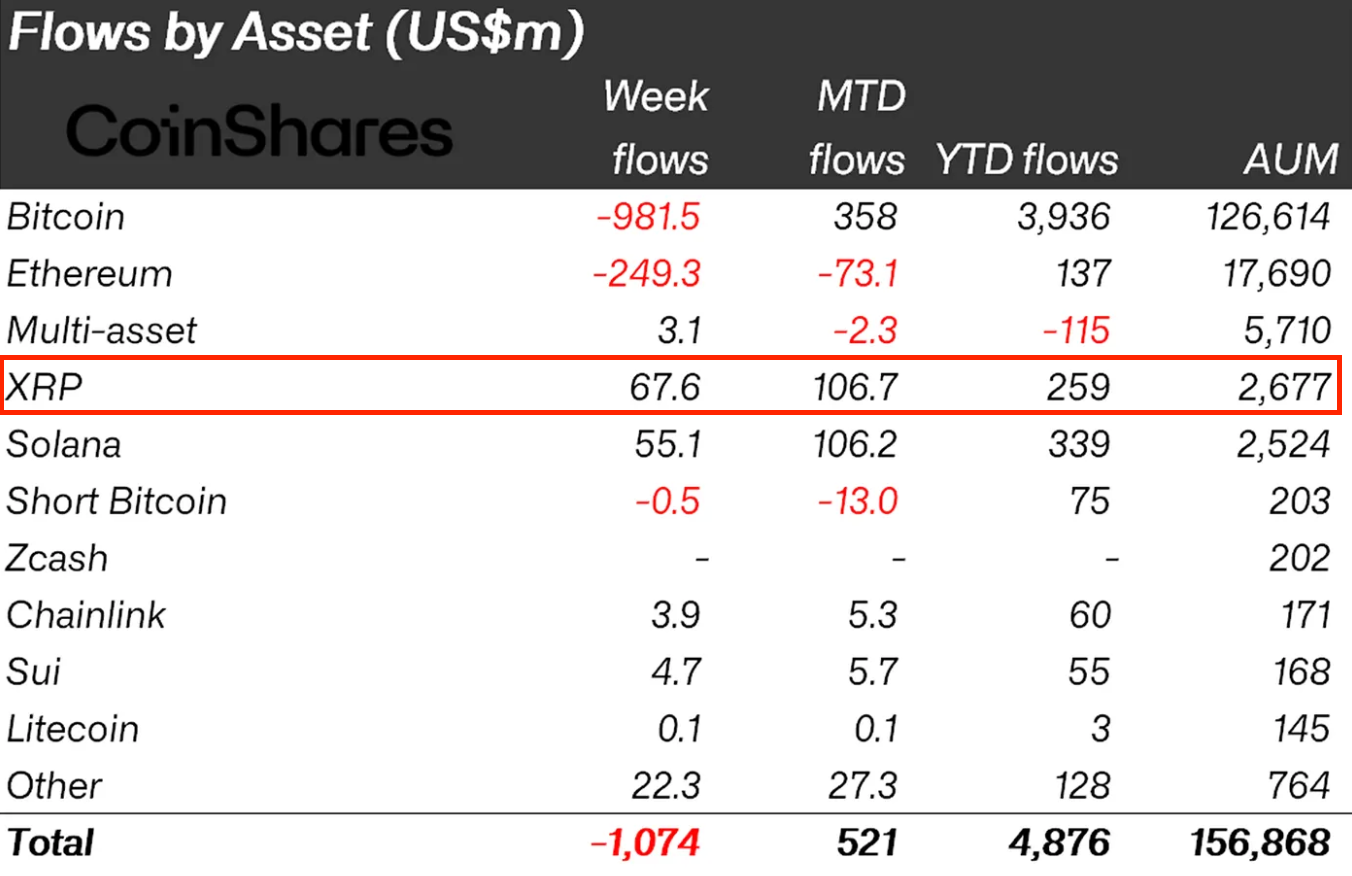
Global crypto ETP flows table. Source: CoinShares
This indicates institutional appetite for XRP products is “heating up, signalling growing confidence in regulated crypto exposure,” TronWeekly said in a post on Tuesday.
As Cointelegraph reported, stronger technical validation, passage of the CLARITY Act in the US and recovering network activity could also contribute to XRP’s recovery.

Subscribe to daily byte-sized crypto news from Cointelegraph
This article is produced in accordance with Cointelegraph's Editorial Policy and is intended for informational purposes only. It does not constitute investment advice or recommendations. All investments and trades carry risk; readers are encouraged to conduct independent research.
More on the subject