
Price predictions 5/1: BTC, ETH, XRP, BNB, SOL, DOGE, HYPE, ADA, BCH, XMR
MarketsPublishedMay 1, 2026
Technical charts suggest that Bitcoin’s rally continuation is fully dependent on bulls securing a weekly close above $75,000.
Key points:
- Bitcoin will have to flip the $80,000 level into support to continue its up move to $84,000.
- Several major altcoins are finding buyers at lower levels, but they will have to overcome the overhead resistance to start a new up move.
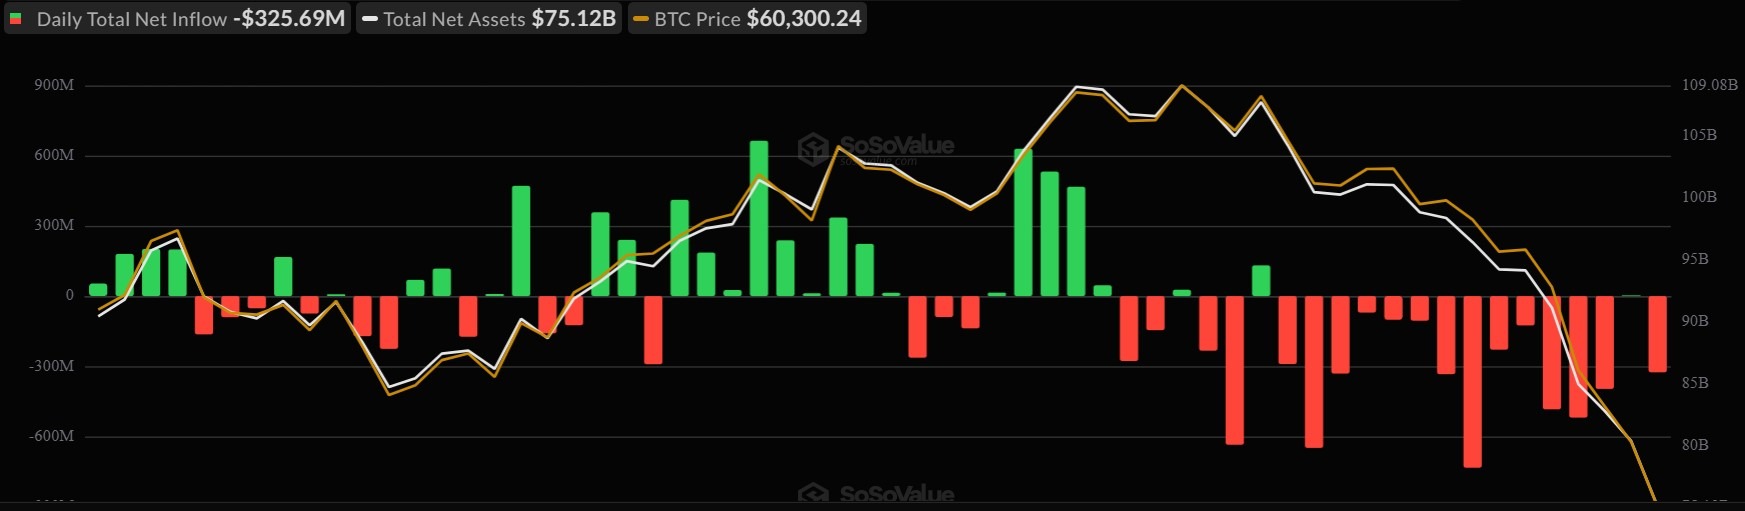
Bitcoin (BTC) has risen above $78,000, extending upon its 11.87% rally in April, per CoinGlass data. The recovery in April was supported by solid buying in the US spot BTC exchange-traded funds, which saw $1.97 billion in inflows, according to SoSoValue data.
The rally is expected to encounter selling in the zone between the True Market Mean at $78,000 and the Short-Term Holder (STH) cost basis at $79,000. Analysts are closely monitoring the $80,000 level, which needs to be flipped into support for confirmation that bulls remain in control.
Crypto market data daily view. Source: TradingView
CryptoQuant is not convinced that BTC’s rally could extend further. In a recent report, the crypto analytics firm said that BTC’s up move in April was fuelled mainly by futures traders, while spot demand contracted. That suggests “the market’s marginal buyer was speculative, not fundamental.” CryptoQuant warned in an X post that the exact setup had “preceded the next leg down” in 2022.
Could BTC and the major altcoins break above their overhead resistance levels? Let’s analyze the charts of the top 10 cryptocurrencies to find out.
Bitcoin price prediction
BTC turned up from the 20-day exponential moving average ($75,814) on Thursday, indicating buying on dips.
BTC/USDT daily chart. Source: Cointelegraph/TradingView
The relief rally is expected to face selling pressure at $79,500, but if buyers pierce the overhead resistance, the uptrend is expected to gain momentum, and the BTC/USDT pair may rally to $84,000.
The 20-day EMA is the crucial support to watch out for on the downside. If the BTC price turns down from the current level or the overhead resistance and breaks below the 20-day EMA, it may start a deeper correction to the 50-day simple moving average ($72,362) and then the support line.
Ether price prediction
Ether (ETH) is finding support near the 50-day SMA ($2,207), indicating that bulls are viewing the dips as a buying opportunity.
ETH/USDT daily chart. Source: Cointelegraph/TradingView
The flattening 20-day EMA and the relative strength index (RSI) just above the midpoint suggest weakening momentum. If the ETH price turns down and breaks below the 50-day SMA, the next stop is likely to be the support line.
Instead, if the price remains above the 20-day EMA, the bulls will attempt to drive the ETH/USDT pair to $2,465 and then to the ascending channel’s resistance. The next trending move is expected to begin on a close above the resistance line or below the support line. Until then, the pair may remain inside the channel.
XRP price prediction
XRP (XRP) remains stuck inside the $1.27 to $1.61 range, signaling buying on dips and selling on rallies.

XRP/USDT daily chart. Source: Cointelegraph/TradingView
The 20-day EMA ($1.39) has started to turn down gradually, and the RSI is near the midpoint, indicating a slight edge to the bears. If the XRP price remains below the moving averages, the likelihood of a drop to the $1.27 support increases.
Buyers are likely to have other plans. They will attempt to thrust the price above the moving averages. If they succeed, the XRP/USDT pair may rally to the downtrend line of the descending channel pattern, then to the $1.61 resistance. A trend change will be signaled on a close above the $1.61 level.
BNB price prediction
BNB (BNB) slipped below the moving averages on Tuesday, but the bears have failed to build upon their advantage. That suggests demand at lower levels.

BNB/USDT daily chart. Source: Cointelegraph/TradingView
The bulls are attempting to push the BNB price back above the moving averages. If they manage to do that, the BNB/USDT pair may rise to $654 and then to the $687 overhead resistance.
On the other hand, if the price turns down and breaks below $610, it signals that the sellers remain in control. The pair may then tumble toward the $570 support, where the buyers are expected to step in.
Solana price prediction
Buyers are attempting to sustain Solana (SOL) above the $82.65 level but the bears continue to exert pressure.

SOL/USDT daily chart. Source: Cointelegraph/TradingView
If the $82.65 level cracks, the SOL/USDT pair may decline to $76. Buyers are expected to defend the $76 level with all their might, as a close below it may start the next leg of the downward move to $67.
On the contrary, if the SOL price rises above the moving averages, it suggests that the pair may remain inside the $82.65 to $90.73 range for some time. A close above $90.73 opens the gates for a retest of the $98 overhead resistance.
Dogecoin price prediction
Dogecoin (DOGE) is showing strength, as bulls prevented the pullback from dipping below the $0.10 level on Thursday.
DOGE/USDT daily chart. Source: Cointelegraph/TradingView
That increases the likelihood of a rally to the $0.12 overhead resistance, where the bears are expected to mount a strong defense. If the price turns sharply lower and breaks below the moving averages, it suggests the DOGE/USDT pair may remain within the $0.09 to $0.12 range for a while longer.
Alternatively, if buyers overcome the $0.12 obstacle, it suggests that the pair may have bottomed out in the near term. The DOGE price may rise to $0.14 and later to $0.16.
Hyperliquid price prediction
Hyperliquid (HYPE) fell below the 50-day SMA ($39.84) on Thursday but the long tail on the candlestick shows buying at lower levels.
HYPE/USDT daily chart. Source: Cointelegraph/TradingView
The bulls are striving to push the HYPE price above the 20-day EMA ($40.85). If they manage to do that, the HYPE/USDT pair may rally toward the $43.76-$45.77 overhead resistance zone. A close above the zone clears the path for a rally to $50.
Contrary to this assumption, if the price turns down and breaks below $38.70, it signals that the bears are selling on rallies. That may start a deeper pullback to $37.77 and subsequently to $34.45.
Related: Did Dogecoin bottom first? DOGE price poised for 20% gains as whales return
Cardano price prediction
Cardano (ADA) has been clinging to the moving averages, indicating that the bulls have kept up the pressure.
ADA/USDT daily chart. Source: Cointelegraph/TradingView
That improves the prospects of a break above the downtrend line. If that happens, the ADA/USDT pair may surge to $0.32 and later to $0.37, signaling a potential short-term trend change.
This bullish view will be invalidated in the near term if the ADA price turns sharply lower and breaks below $0.22. Such a move suggests that the pair may remain inside the descending channel for a few more days.
Bitcoin Cash price prediction
Bitcoin Cash (BCH) bounced off $443 again, indicating that the bulls are aggressively defending the level.
BCH/USDT daily chart. Source: Cointelegraph/TradingView
There is minor resistance at the 50-day SMA ($453), but it is likely to be crossed. The BCH/USDT pair may then soar to $486, at which point bears are expected to sell aggressively. However, if buyers overcome the barrier, the pair may rally to $520.
Contrary to this assumption, if the BCH price turns sharply lower from $486 and breaks below the moving averages, it suggests that bears remain sellers on rallies. That may keep the pair range-bound between $419 and $486 for some time.
Monero price prediction
Monero (XMR) bounced off the 20-day EMA ($366) on Wednesday, indicating a positive sentiment.

XMR/USDT daily chart. Source: Cointelegraph/TradingView
The upsloping 20-day EMA and the RSI in positive territory indicate that the path of least resistance is upward. If buyers push and maintain the XMR price above the $406 resistance, the rally may reach the $500 level.
Conversely, if the price turns sharply lower from the overhead resistance and breaks below the moving averages, it suggests that the XMR/USDT pair may remain range-bound between $302 and $406 for some time.

Subscribe to daily byte-sized crypto news from Cointelegraph
This article is produced in accordance with Cointelegraph's Editorial Policy and is intended for informational purposes only. It does not constitute investment advice or recommendations. All investments and trades carry risk; readers are encouraged to conduct independent research.
More on the subject