
Price predictions 5/20: BTC, ETH, BNB, XRP, SOL, DOGE, HYPE, ADA, ZEC, BCH
MarketsPublishedMay 20, 2026
Bitcoin looks on track for a rally toward $80,000 while HYPE, ZEC and a handful of altcoins are pushing toward their range highs.

Key points:
- Bitcoin is at a critical juncture, as a close below $76,000 may deepen the pullback toward $70,000.
- HYPE and ZEC are in an up move, but most other major altcoins are struggling to find support.
Bitcoin (BTC) has risen above $77,500, but the recovery is expected to face resistance in the $78,500-$82,000 range. The net outflows of $979.7 million from spot BTC exchange-traded funds this week, according to Fireside Investors data, suggest that investors have turned cautious in the near term.
Crypto analyst Ardi said in a post on X that the next retest of the $74,000 to $75,000 zone may be the most important test of this entire bear market. The zone is important because it acted as stiff resistance in 2024 and then flipped into support during the retest in 2025. A break below the support zone may “expose the market to a much deeper rotation back toward the bear market lows.”
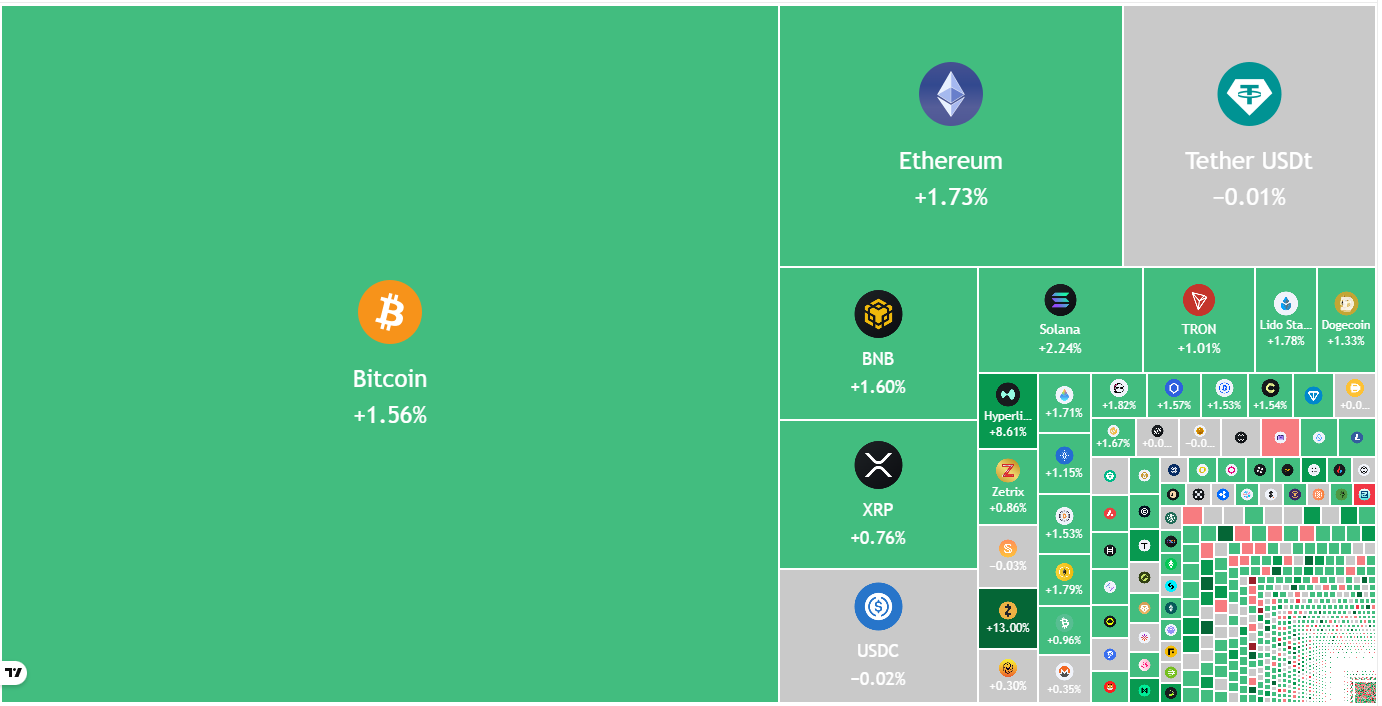
Crypto market data daily view. Source: TradingView
Although BTC appears weak in the near term, analysts do not anticipate a sharp decline. CryptoQuant analyst Sunny Mom said in a recent QuickTake analysis that if BTC holds the $70,700 level, it is likely to consolidate in the $70,000 to $82,000 range “to burn time and digest the supply.”
Could BTC and the major altcoins start a strong recovery? Let’s analyze the charts of the top 10 cryptocurrencies to find out.
Bitcoin price prediction
BTC is attempting a bounce off the breakout level at $76,000, indicating that the bulls are striving to turn it into support.
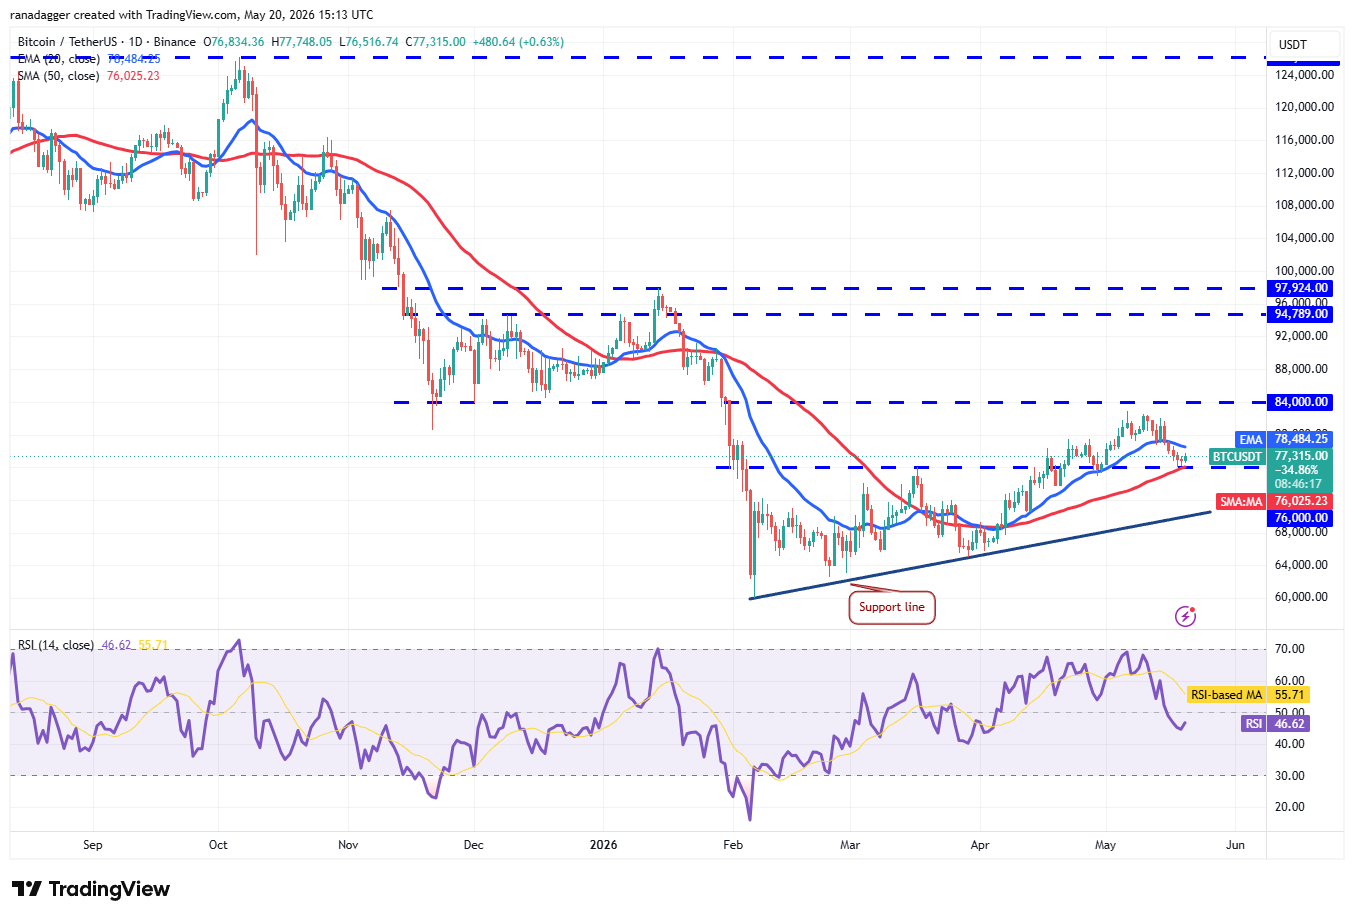
BTC/USDT daily chart. Source: Cointelegraph/TradingView
Sellers are unlikely to give up easily and may vigorously defend the 20-day exponential moving average ($78,484). If the BTC price turns down sharply from the 20-day EMA, it increases the risk of a break below $76,000. If that happens, the BTC/USDT pair may plunge to the support line.
Contrarily, a close above the 20-day EMA signals demand at lower levels. The bulls will then endeavor to push the pair to the overhead resistance at $84,000. This is a critical level for the bears to defend, as a close above it clears the path for a rally toward $97,924.
Ether price prediction
Ether (ETH) fell below the support line of the ascending channel pattern on Sunday, but the bears have not been able to capitalize on the breakdown.
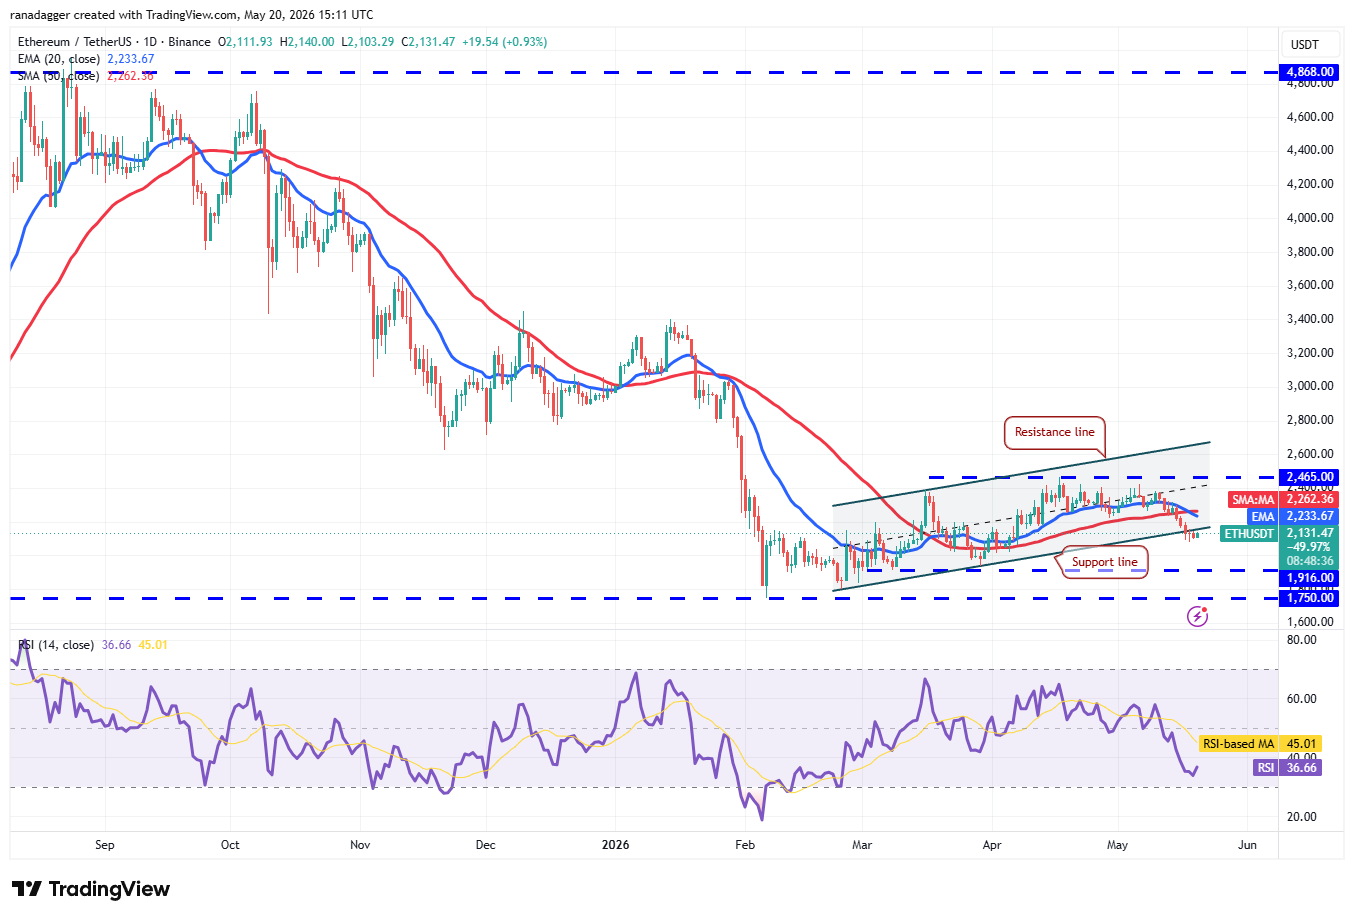
ETH/USDT daily chart. Source: Cointelegraph/TradingView
The bulls are striving to push the ETH price back into the channel. If they succeed, the next hurdle is likely to be at the moving averages. If the price turns sharply down relative to the moving averages, the risk of a drop to $1,916 increases.
Alternatively, a close above the moving averages suggests that the market has rejected the break below the support line. The ETH/USDT pair may then rally to $2,465, then to the resistance line.
BNB price prediction
BNB (BNB) is attempting to find support at the 50-day SMA ($629), indicating a lack of aggressive selling at lower levels.
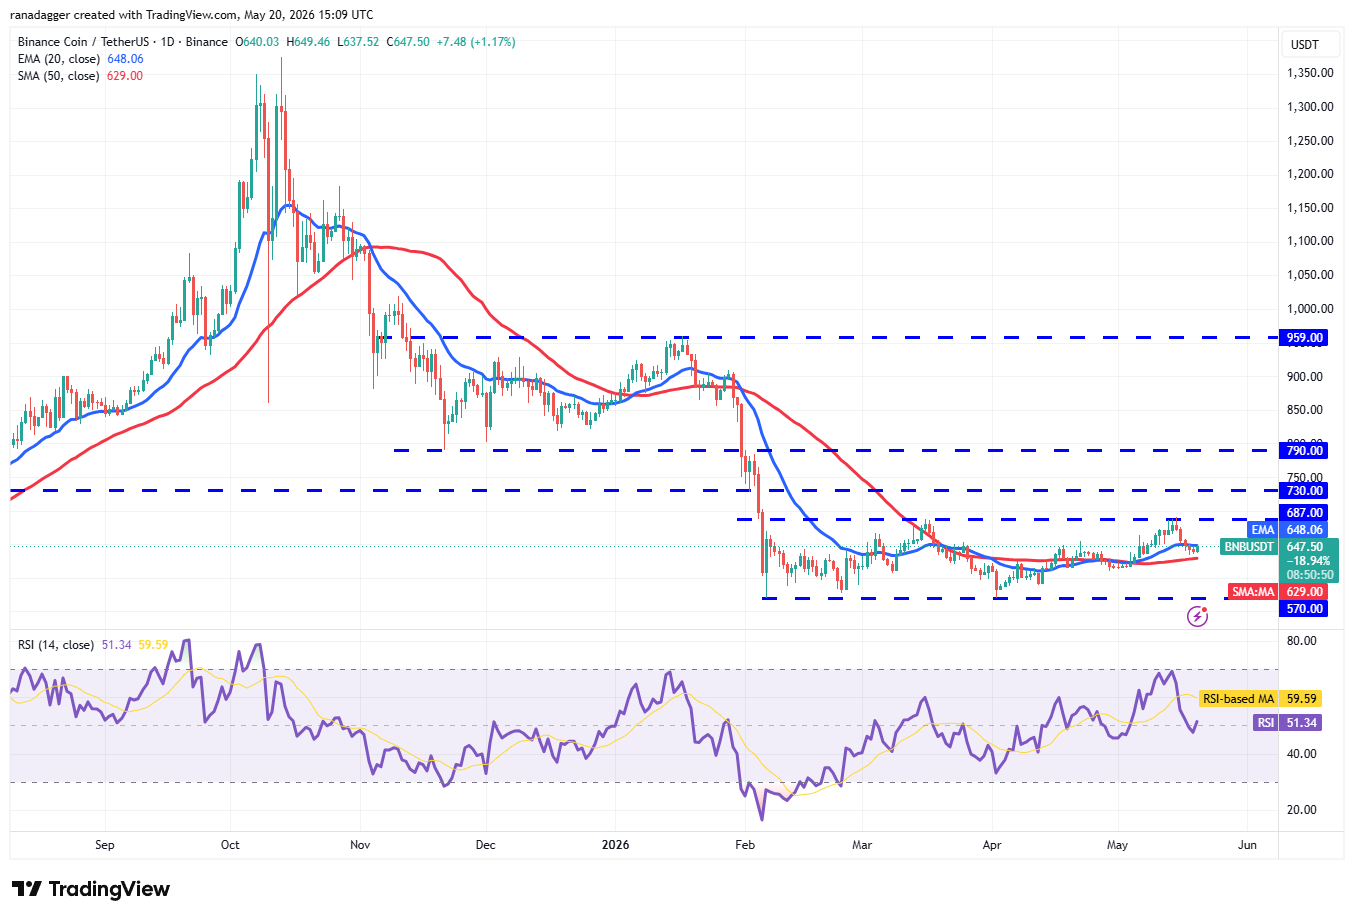
BNB/USDT daily chart. Source: Cointelegraph/TradingView
If the price closes above the 20-day EMA ($648), the bulls will again strive to push the BNB/USDT pair to the $687 resistance. Sellers are expected to aggressively defend the level, as a close above it may push the BNB price to $730 and, after that, to $790. That indicates the pair may have bottomed out in the short term.
Instead, if the price turns down and breaks below the 50-day SMA, it suggests the pair may remain within the $570 to $687 range for some time.
XRP price prediction
XRP (XRP) closed below the 50-day SMA ($1.39) on Monday, but a minor positive is that the bulls have not let the price dip to $1.27.
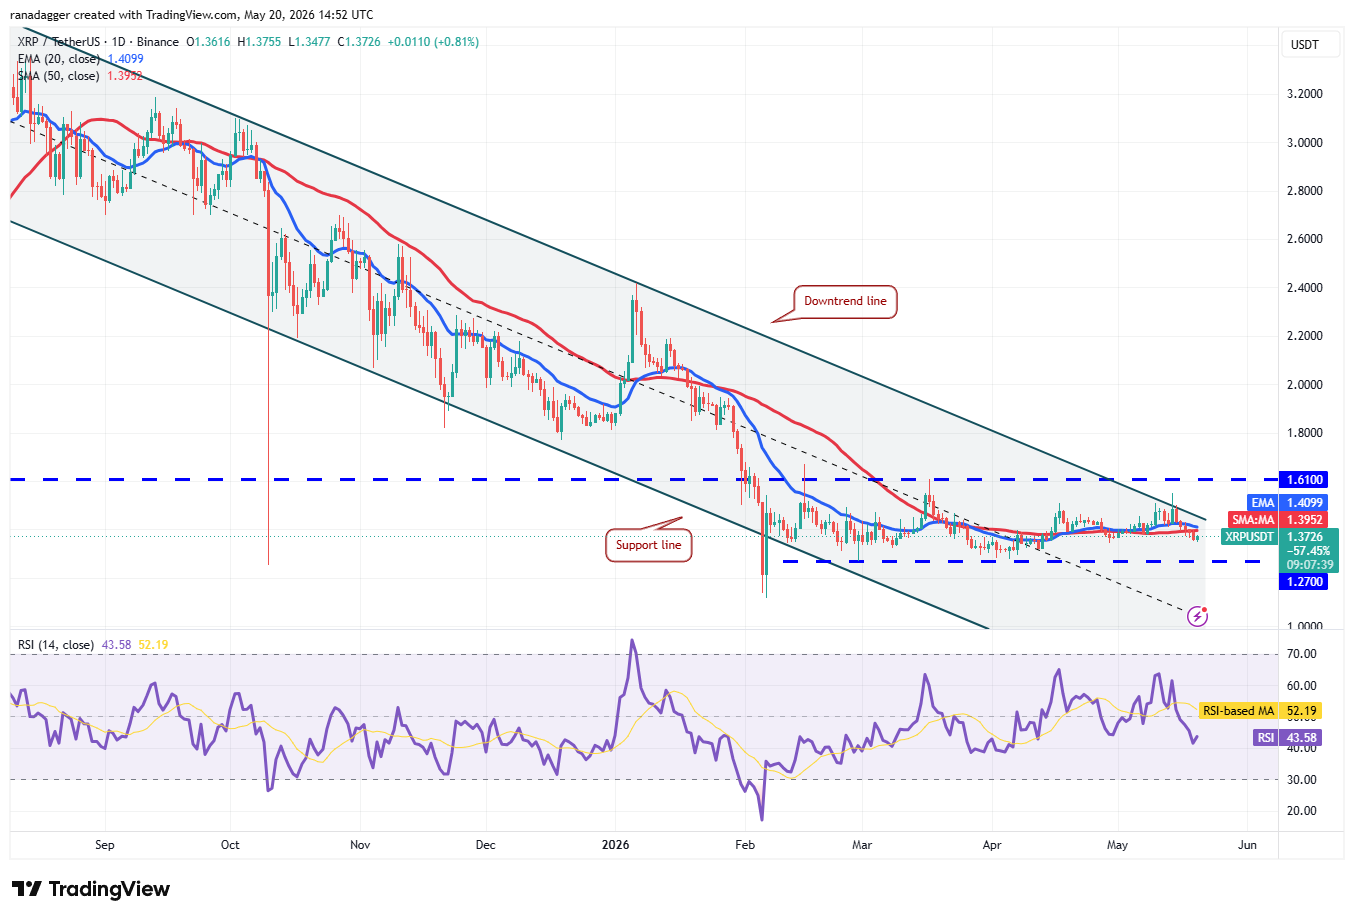
XRP/USDT daily chart. Source: Cointelegraph/TradingView
Buyers will have to achieve a close above the downtrend line to signal a comeback. The XRP/USDT pair may then move higher toward the $1.61 level, where bears are expected to step in. A close above the $1.61 resistance signals a potential trend change. The XRP price may then rally to $2 and later to $2.40.
On the contrary, if the price continues lower and or turns down from the downtrend line, it suggests that the bears remain in control. That increases the risk of a break below the $1.27 support. If that happens, the pair may plummet to $1.11.
Solana price prediction
Solana (SOL) has held above the $82.65 support over the past few days, but bulls are struggling to trigger a strong rebound.
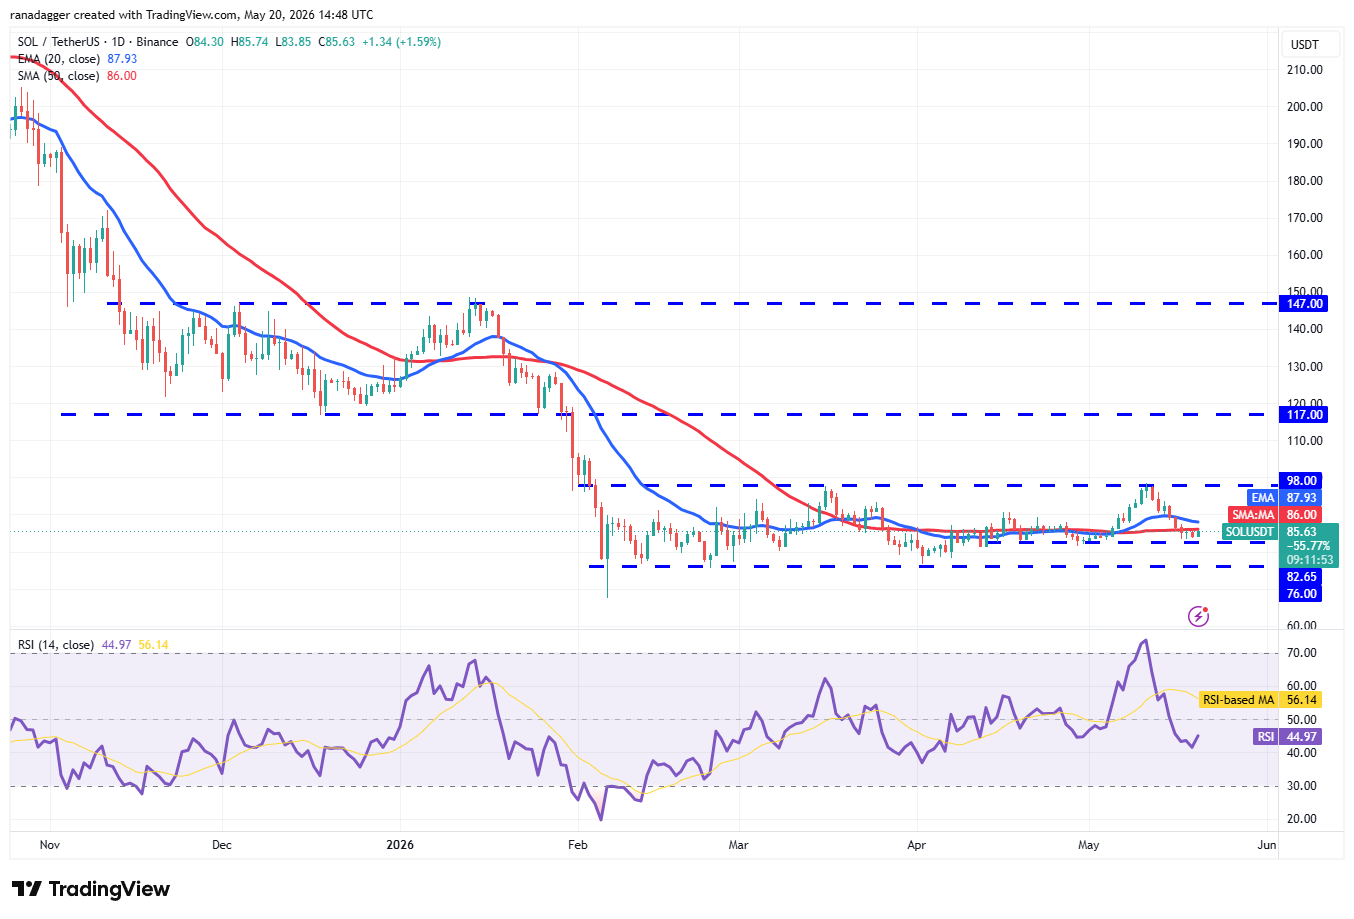
SOL/USDT daily chart. Source: Cointelegraph/TradingView
The 20-day EMA ($87.93) has begun to turn lower, and the RSI is in negative territory, indicating a slight advantage for bears. If the SOL price turns sharply down from the 20-day EMA, the likelihood of a break below $82.65 increases. The SOL/USDT pair may then descend to the $76 support.
Buyers are likely to have other plans. They will attempt to push the price above the 20-day EMA and the $91 resistance. If they do that, the pair may reach the $98 level.
Dogecoin price prediction
Dogecoin (DOGE) has been stuck in the $0.09-$0.12 range, suggesting buying on dips and selling on rallies.
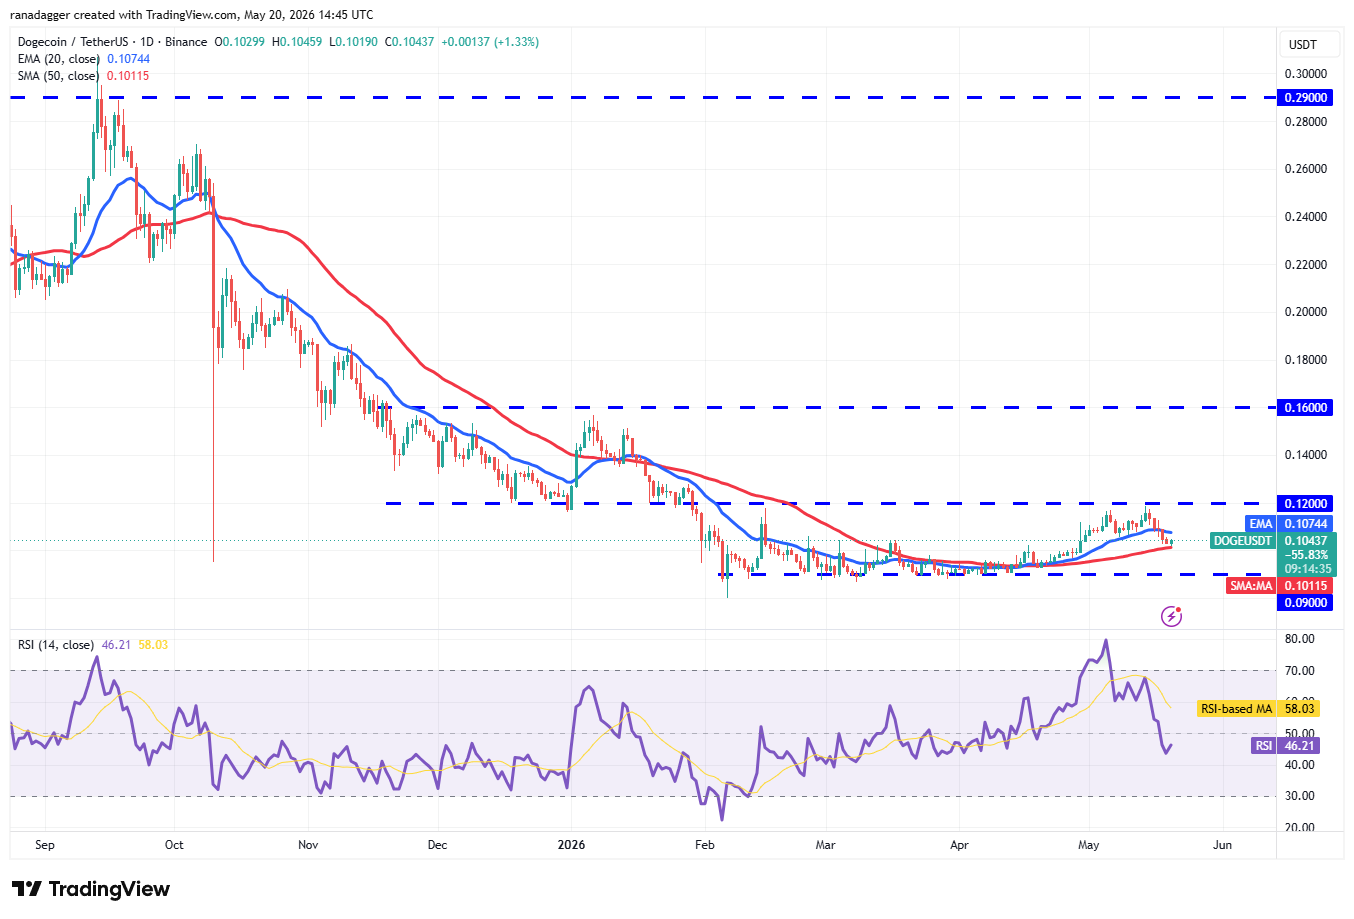
DOGE/USDT daily chart. Source: Cointelegraph/TradingView
The bulls are attempting to start a bounce off the 50-day SMA ($0.10), but are expected to hit a hurdle at the 20-day EMA ($0.11). If the DOGE price turns down sharply from the 20-day EMA, the likelihood of a drop to $0.09 increases.
On the other hand, a close above the 20-day EMA suggests that the DOGE/USDT pair may climb to the $0.12 resistance. Buyers will have to push and maintain the price above $0.12 to signal the start of a new uptrend to $0.14, and subsequently to $0.16.
Hyperliquid price prediction
Hyperliquid (HYPE) closed above the $45.77 resistance on Monday, signaling the resumption of the uptrend.
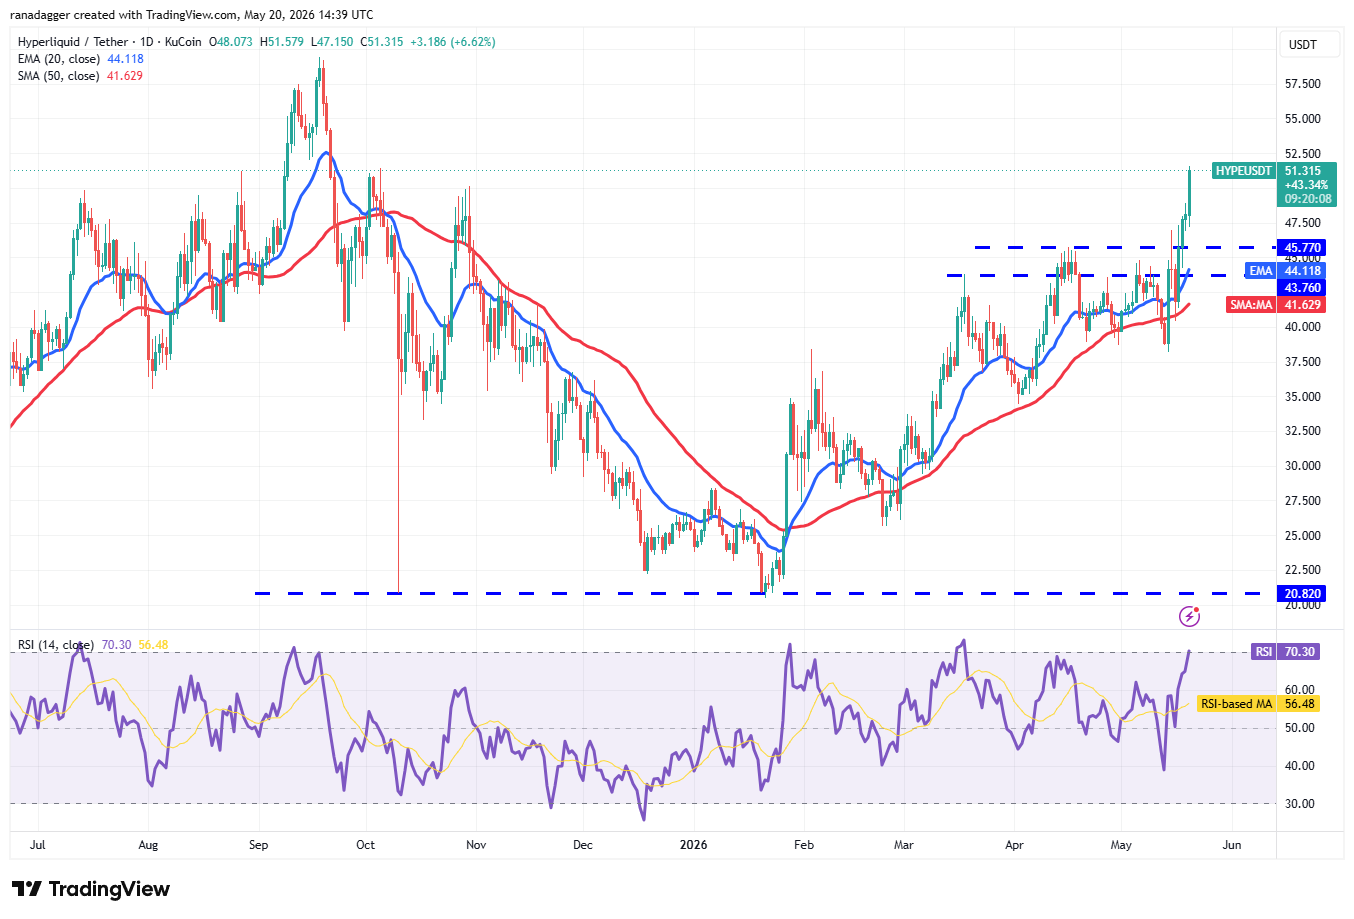
HYPE/USDT daily chart. Source: Cointelegraph/TradingView
There is resistance at $51.43, but if the bulls pierce the level, the HYPE price may surge toward $59.41. Sellers are expected to fiercely defend the $59.41 level, as a break above it could push the HYPE/USDT pair into uncharted territory.
The first support on the downside is the breakout level of $45.77 and then the 20-day EMA ($44.11). Sellers will have to pull the price below the 20-day EMA to suggest that the bulls are losing their grip. The pair may then tumble to the 50-day SMA ($41.62).
Related: Ethereum traders warn of a ‘nasty’ ETH price drop if $2K support breaks
Cardano price prediction
Cardano (ADA) has been clinging to the 50-day SMA ($0.25), indicating that the bulls are attempting to reclaim the level.
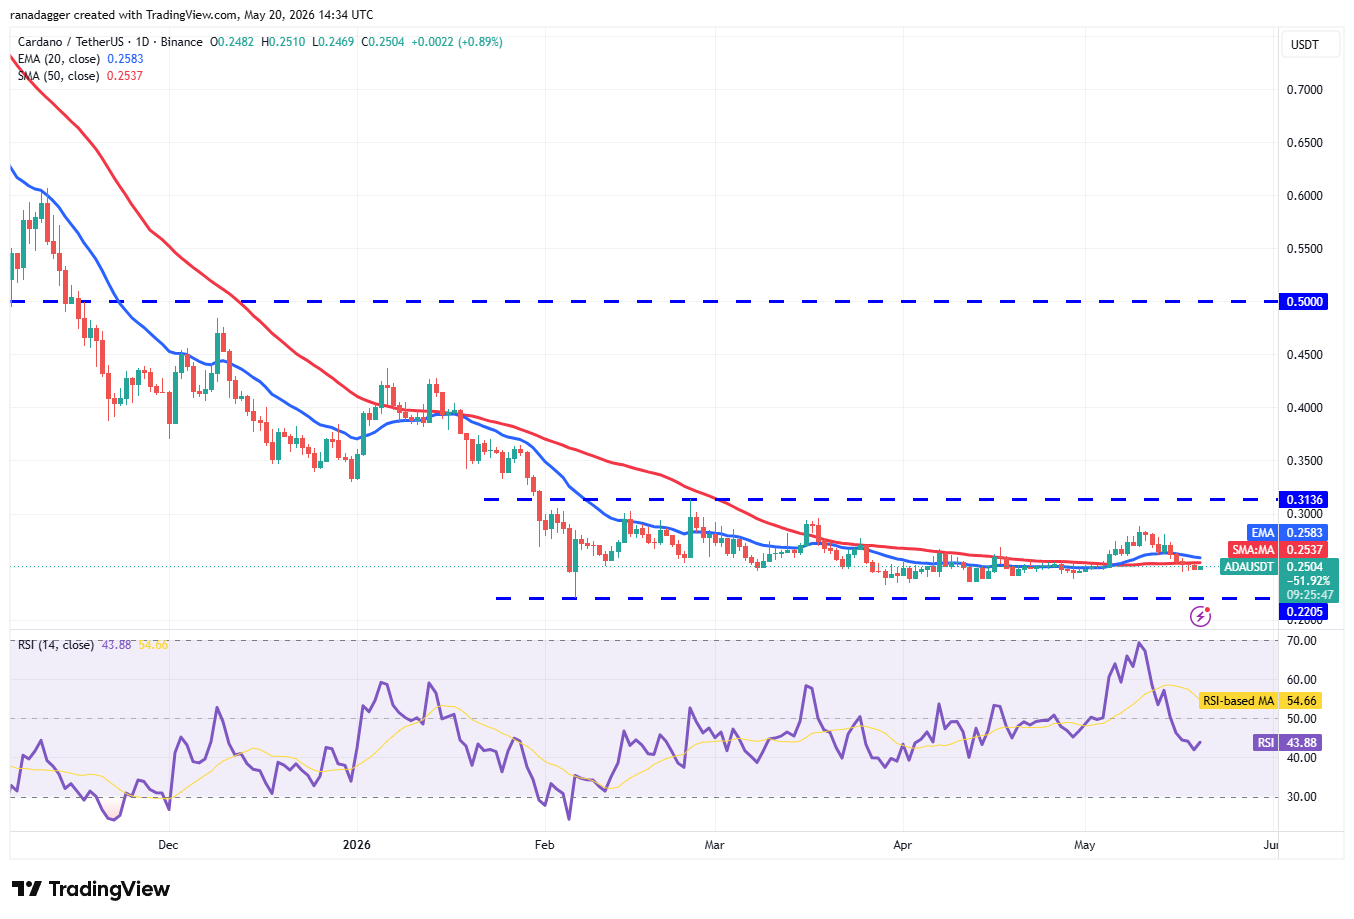
ADA/USDT daily chart. Source: Cointelegraph/TradingView
Any recovery is expected to face selling at the 20-day EMA ($0.26). If the price turns sharply down from the 20-day EMA, the bears will attempt to drive the ADA/USDT pair toward the solid support at $0.22.
On the upside, a break and close above the 20-day EMA signals strength. The ADA price may rise toward $0.29, then to $0.31, where bears are likely to mount a strong defense.
Zcash price prediction
Zcash (ZEC) bounced off the 20-day EMA ($519) on Sunday, indicating that the bulls continue to buy the dips.
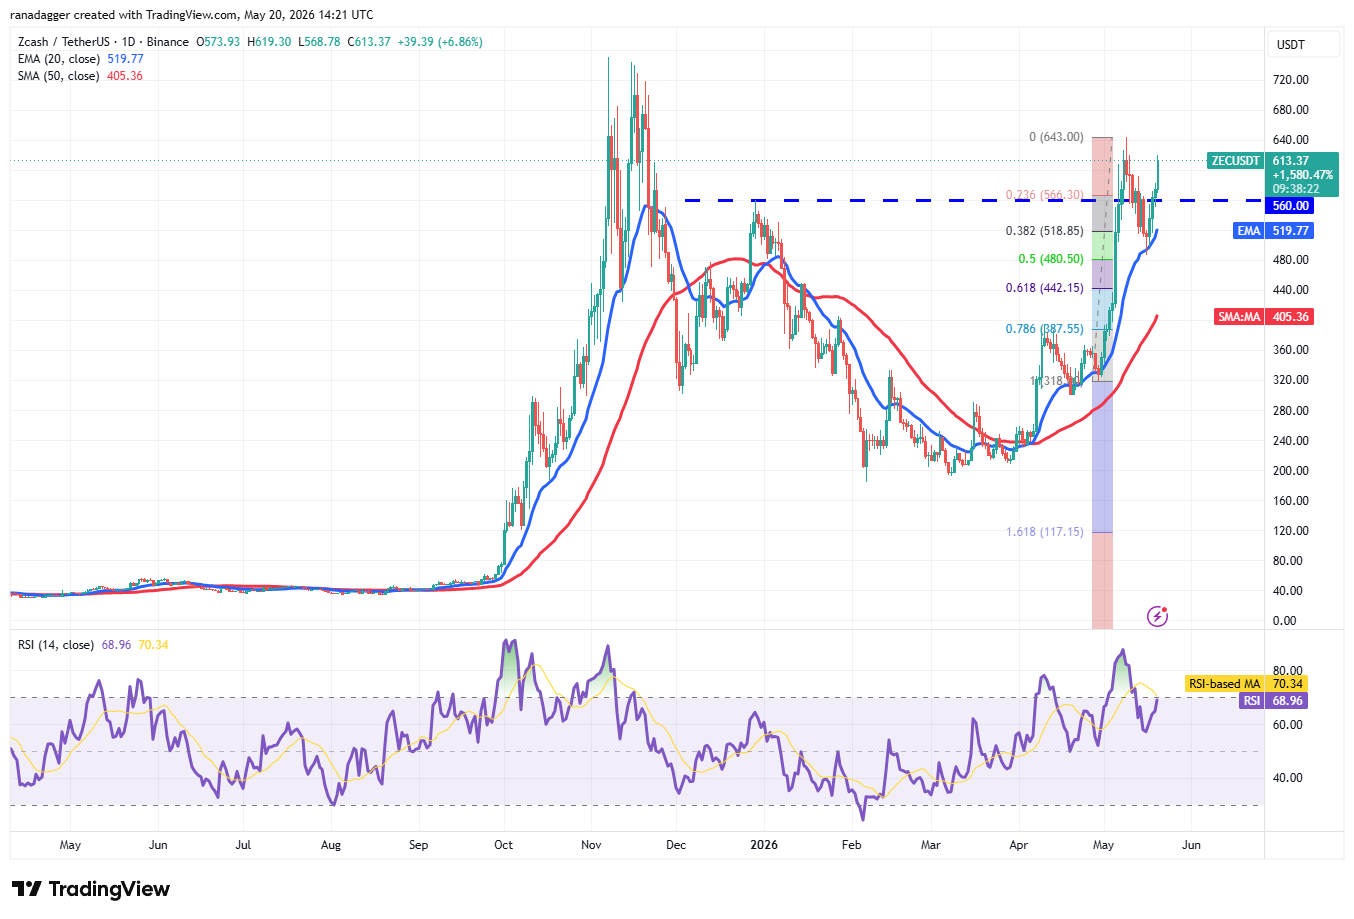
ZEC/USDT daily chart. Source: Cointelegraph/TradingView
Buyers will need to drive the ZEC price above $643 to initiate the next leg of the uptrend. The ZEC/USDT pair may then skyrocket toward $750, where the bears are expected to mount a strong defense.
The first support to watch out for on the downside is the 20-day EMA. A break and close below the 20-day EMA suggests that the traders are booking profits. That may pull the pair to the 61.8% Fibonacci retracement level of $442.
Bitcoin Cash price prediction
Bitcoin Cash (BCH) closed below the $419 support on Saturday, signaling the resumption of the downtrend.
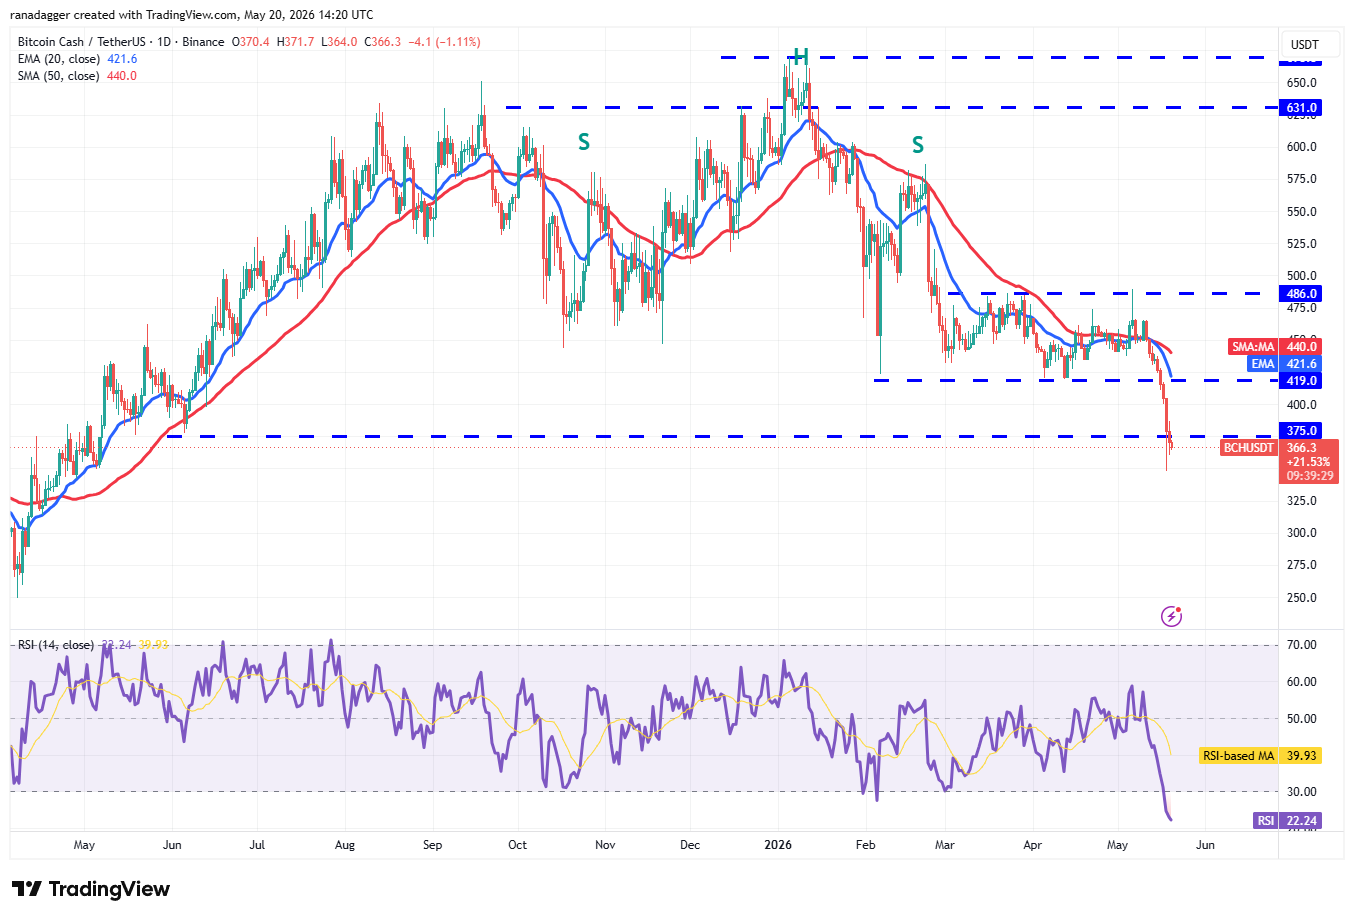
BCH/USDT daily chart. Source: Cointelegraph/TradingView
The selling picked up momentum, and the BCH/USDT pair fell below the $375 support on Monday. Buyers are attempting to push the price back above $375, but the bears have held their ground. If the BCH price turns down from $375 and breaks below $348, the pair may plummet to $300.
Buyers have an uphill task ahead of them. They will have to push the price above the 20-day EMA ($421) and maintain it to signal a comeback.


Subscribe to daily byte-sized crypto news from Cointelegraph
This article is produced in accordance with Cointelegraph's Editorial Policy and is intended for informational purposes only. It does not constitute investment advice or recommendations. All investments and trades carry risk; readers are encouraged to conduct independent research.