Price predictions 4/24: BTC, ETH, XRP, BNB, SOL, DOGE, HYPE, ADA, BCH, XMR
MarketsPublishedApr 24, 2026
Bitcoin’s rally above a long-term resistance level and consistent inflows to the spot BTC ETFs raise the chances of a rally to $80,000. Which altcoins may follow?

Key points:
- Bitcoin sellers are defending the $80,000 level, but the shallow pullback suggests the bulls are not closing their positions in a hurry.
- Several major altcoins continue to face selling near overhead resistance levels, restricting the rally to mainly BTC, Ether and SOL.
Bitcoin (BTC) is facing selling near $80,000, but the bulls have not ceded much ground to the bears. That suggests the bulls are holding their positions as they anticipate the recovery continuing. US spot BTC exchange-traded funds recorded $223 million in inflows on Thursday, the eighth consecutive day of intake, according to Farside Investors data.
Bitcoin was not alone in its rally; analysts anticipate altcoins may join the party soon. MN Trading Capital founder Michael van de Poppe said in a post on X that BTC may surge to $86,000 and the altcoins may rally “30-60% from here.” On the downside, Van de Poppe does not expect BTC to drop below $75,000.
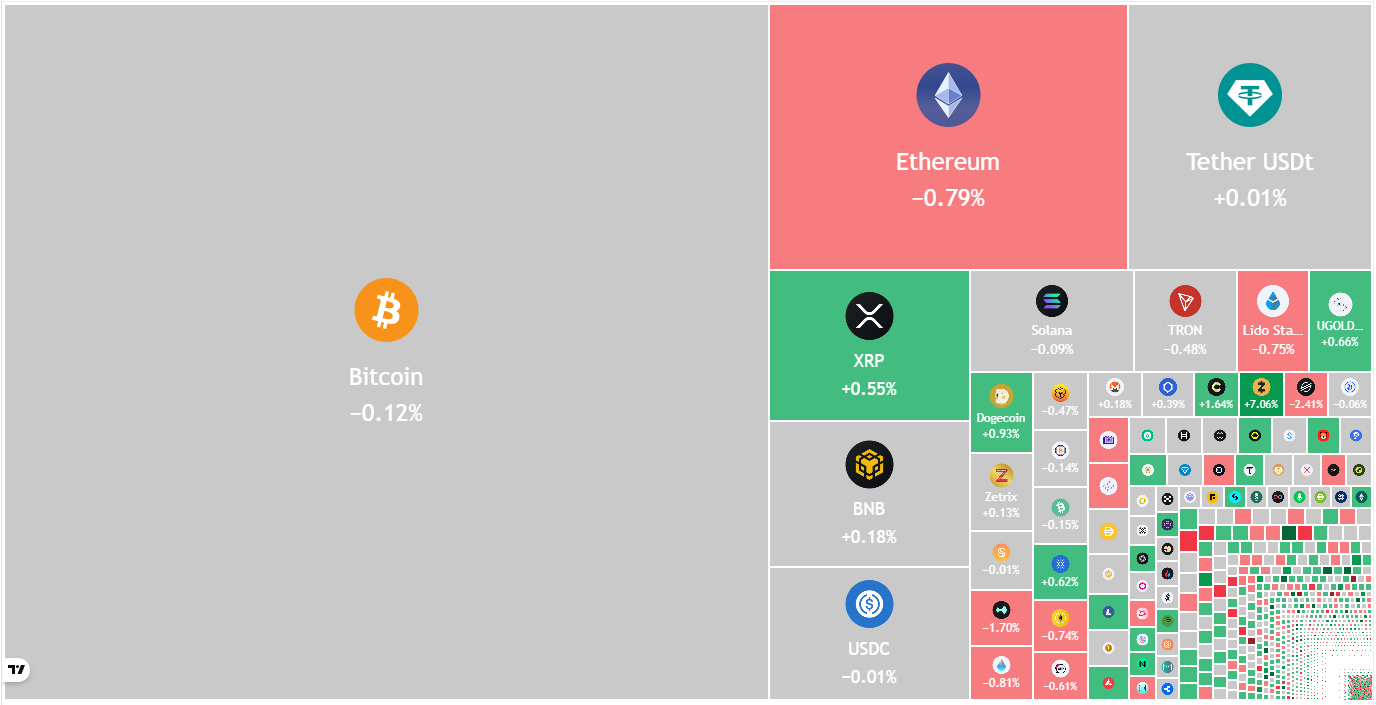
Crypto market data daily view. Source: TradingView
However, BTC’s move higher is unlikely to be easy, as bears are expected to pose substantial resistance near $80,000. CoinGlass said in a post on X that BTC’s whale order book shows “heavy sell pressure” in the $78,000-$80,000 range.
Could BTC and select major altcoins resume their relief rally? Let’s analyze the charts of the top 10 cryptocurrencies to find out.
Bitcoin price prediction
BTC rose above the $78,333 resistance on Wednesday, but bulls failed to sustain the move higher.
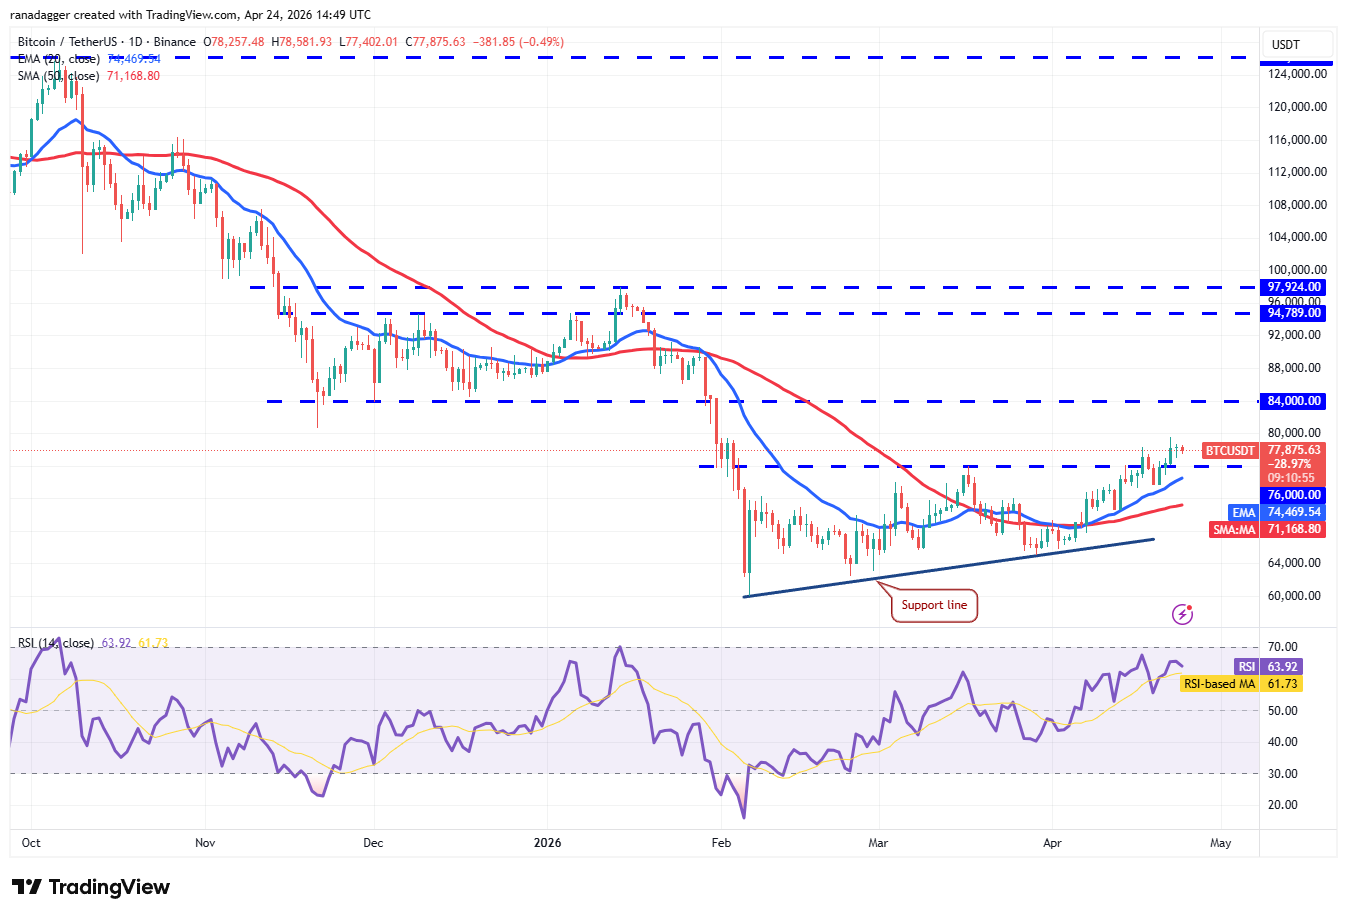
BTC/USDT daily chart. Source: Cointelegraph/TradingView
That suggests the bears have not given up and continue to sell on rallies. The 20-day exponential moving average ($74,469) is the crucial support to watch out for on the downside. If the price rebounds off the 20-day EMA, the bulls will again attempt to thrust the BTC/USDT pair toward the $84,000 level.
Contrary to this assumption, if the BTC price turns down and breaks below the 20-day EMA, it suggests that the bulls have given up. The pair may then descend to the 50-day simple moving average ($71,168).
Ether price prediction
Ether (ETH) turned down from the $2,465 resistance on Wednesday and fell to the 20-day EMA ($2,280).
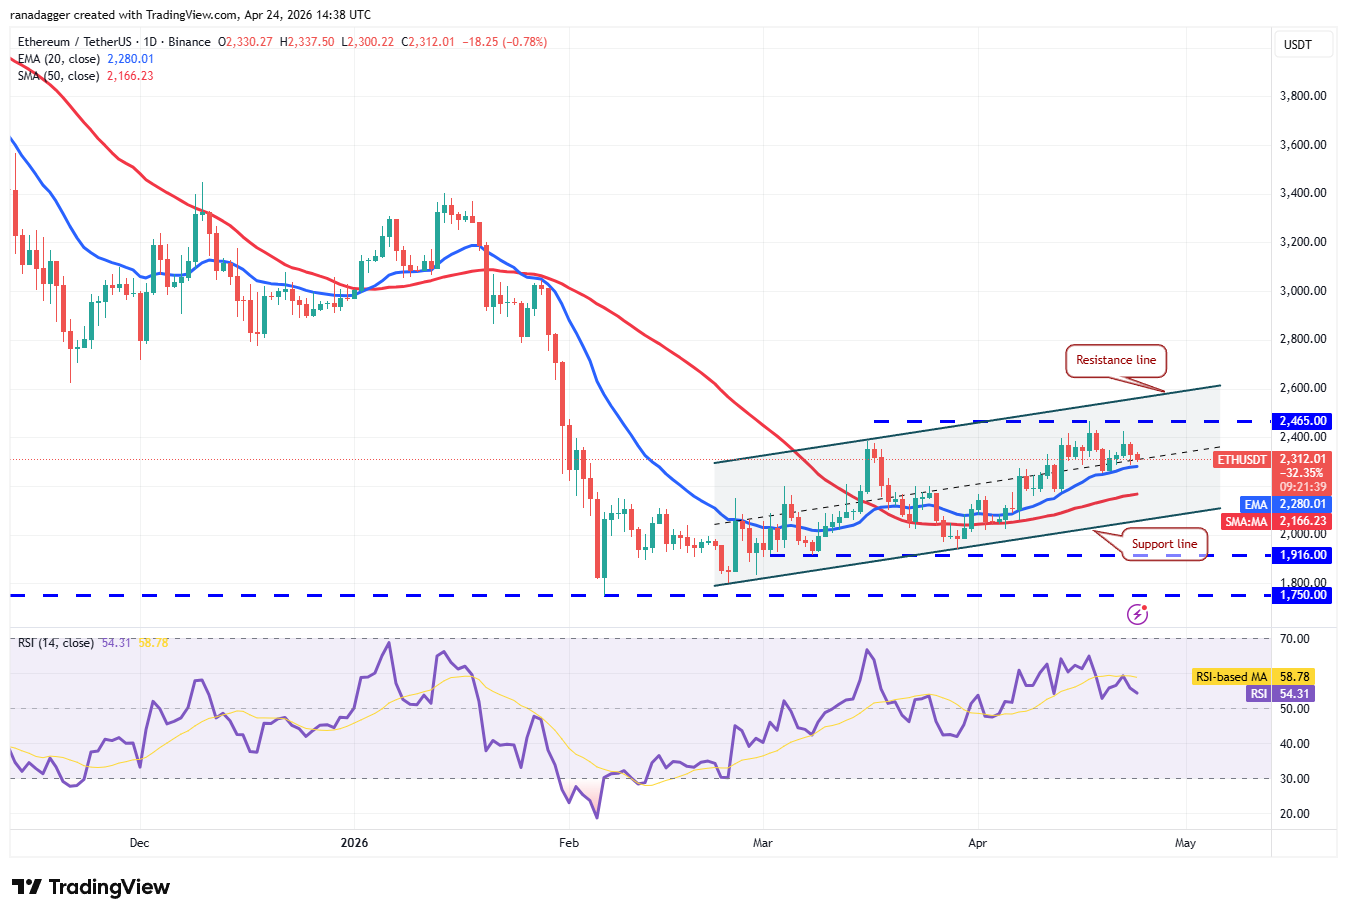
ETH/USDT daily chart. Source: Cointelegraph/TradingView
If the 20-day EMA breaks down, the ETH price may tumble to the 50-day SMA ($2,166) and later to the support line of the ascending channel pattern.
Contrarily, a strong bounce off the 20-day EMA suggests a positive sentiment. That improves the prospects of a break above the $2,465 level. The ETH/USDT pair may then rise to the resistance line, where the bears are expected to mount a strong defense. However, if buyers overcome the obstacle, the pair may skyrocket to $3,050.
XRP price prediction
Buyers have held XRP (XRP) above the moving averages but are struggling to push the price toward the downtrend line.
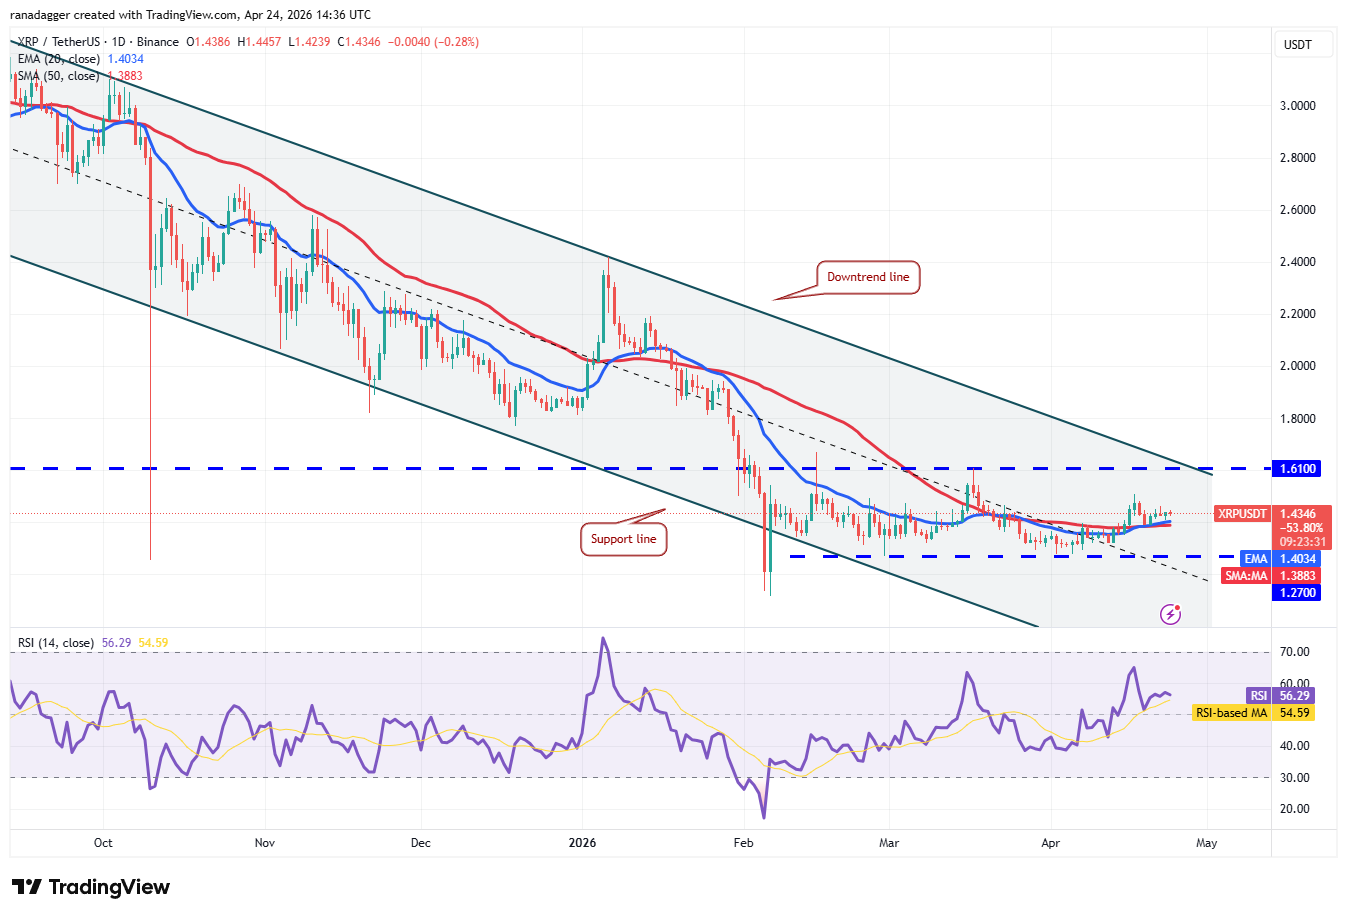
XRP/USDT daily chart. Source: Cointelegraph/TradingView
That suggests a lack of demand at higher levels and increases the risk of a break below the moving averages. If that happens, the XRP/USDT pair may consolidate between $1.27 and $1.61 for a few more days.
Instead, if the XRP price bounces off the moving averages and breaks above $1.51, it indicates an advantage to the bulls. A trend change will be signaled on a close above the downtrend line.
BNB price prediction
Buyers pushed BNB (BNB) above the $649 resistance on Wednesday but could not sustain the higher levels.
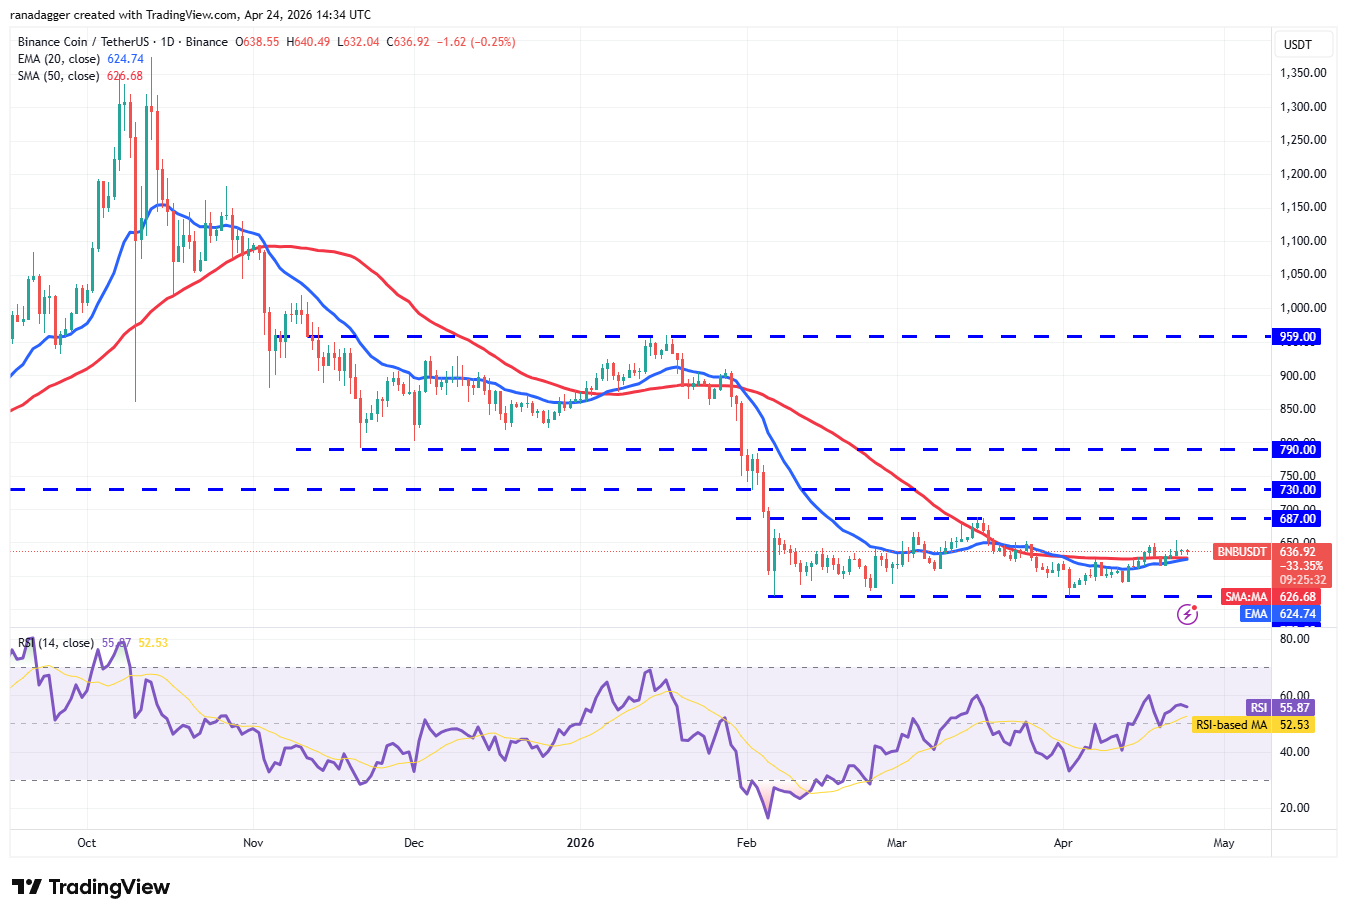
BNB/USDT daily chart. Source: Cointelegraph/TradingView
Sellers are attempting to strengthen their position by pulling the BNB price below the moving averages. If they succeed, the BNB/USDT pair may swing between $570 and $687 for a while longer.
The next trending move is expected to begin on a close above the $687 resistance or below the $570 support. If the $687 level is scaled, the pair may soar to $790. Conversely, a close below $570 may sink the pair to $500.
Solana price prediction
Solana (SOL) has been clinging to the moving averages over the past few days, signaling a state of equilibrium between bulls and bears.
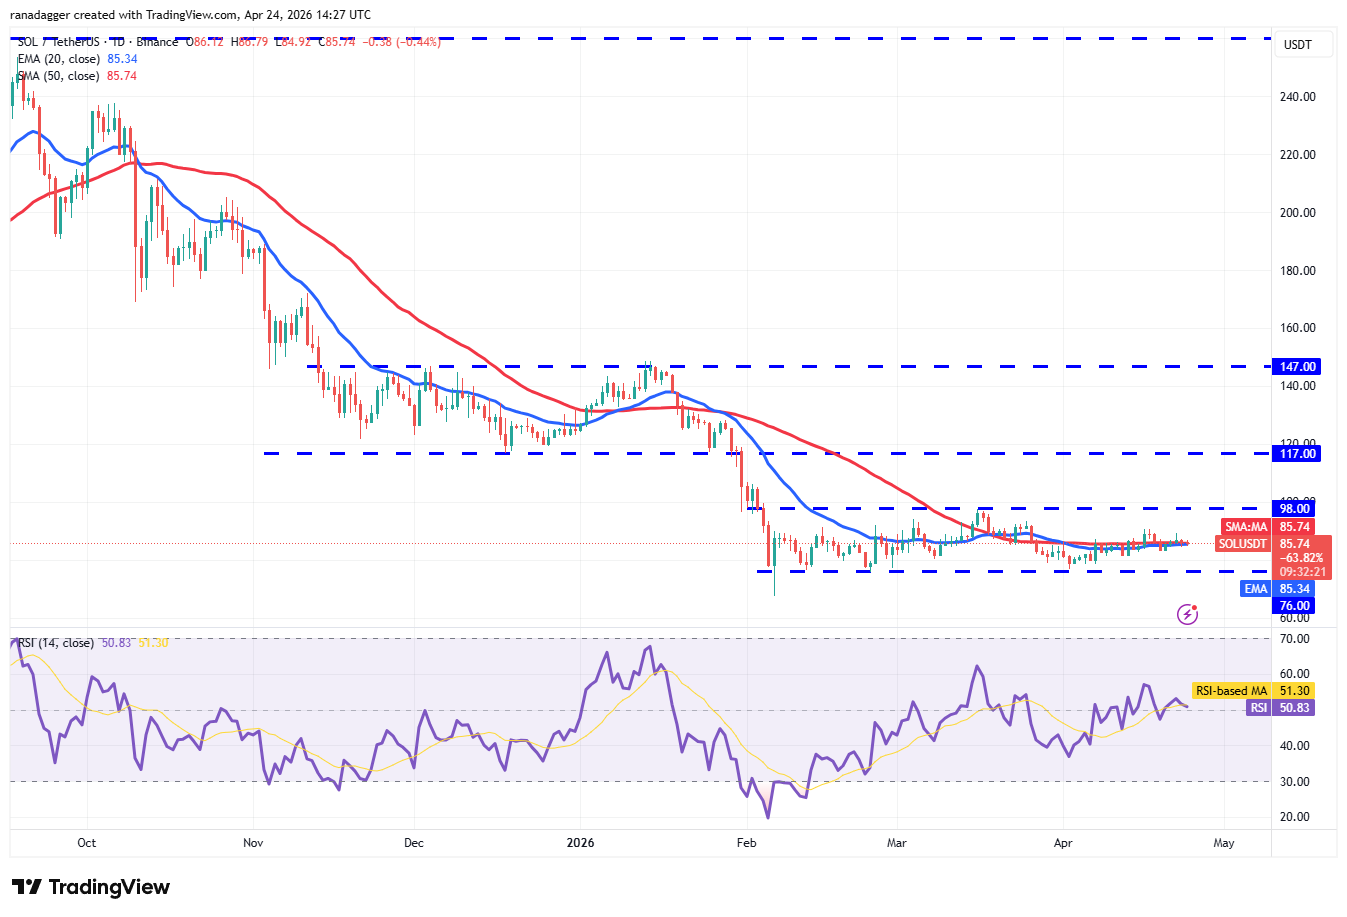
SOL/USDT daily chart. Source: Cointelegraph/TradingView
The flattish moving averages and the RSI near the midpoint suggest that the SOL/USDT pair may remain inside the $76 to $98 range for some more time.
Buyers will be back in the driver’s seat on a close above the $98 resistance. That opens the doors for a rally to $117. On the downside, the bears will have to push the SOL price below $76 to gain the upper hand. The pair may then slump to the crucial $67 support.
Dogecoin price prediction
Dogecoin (DOGE) is struggling to break above the $0.10 resistance level, suggesting bears are aggressively defending it.
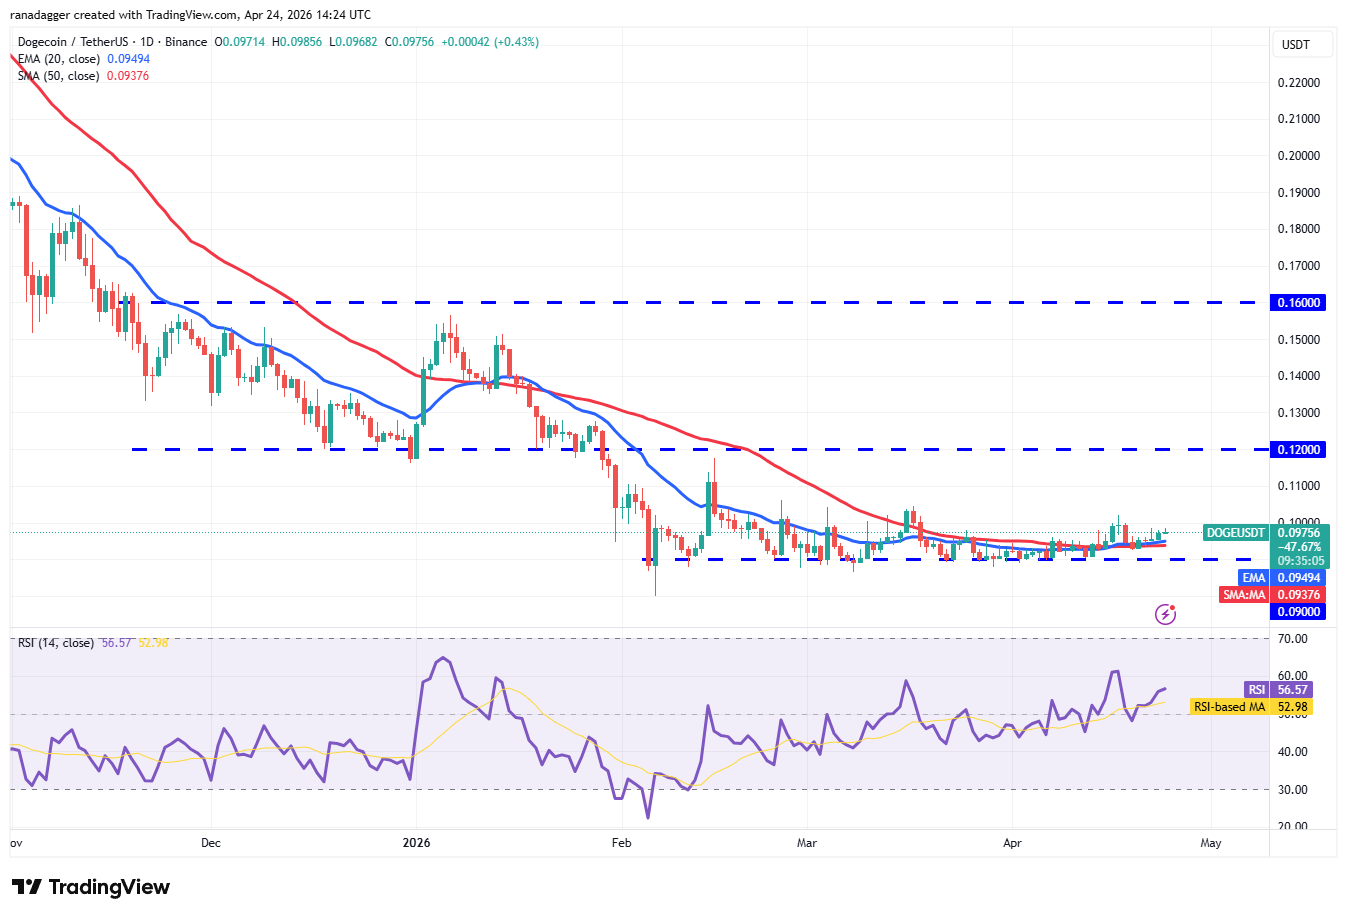
DOGE/USDT daily chart. Source: Cointelegraph/TradingView
The 20-day EMA ($0.09) has started to turn up, and the RSI is in the positive zone, signaling that the bulls have the upper hand. If the $0.10 level is taken out, the DOGE/USDT pair may surge to the $0.12 resistance.
On the contrary, if the DOGE price turns down and breaks below the moving averages, it suggests that the bulls have given up. That increases the risk of a break below the $0.09 support.
Hyperliquid price prediction
Hyperliquid (HYPE) is witnessing a tough battle between the bulls and the bears at the 20-day EMA ($40.95).
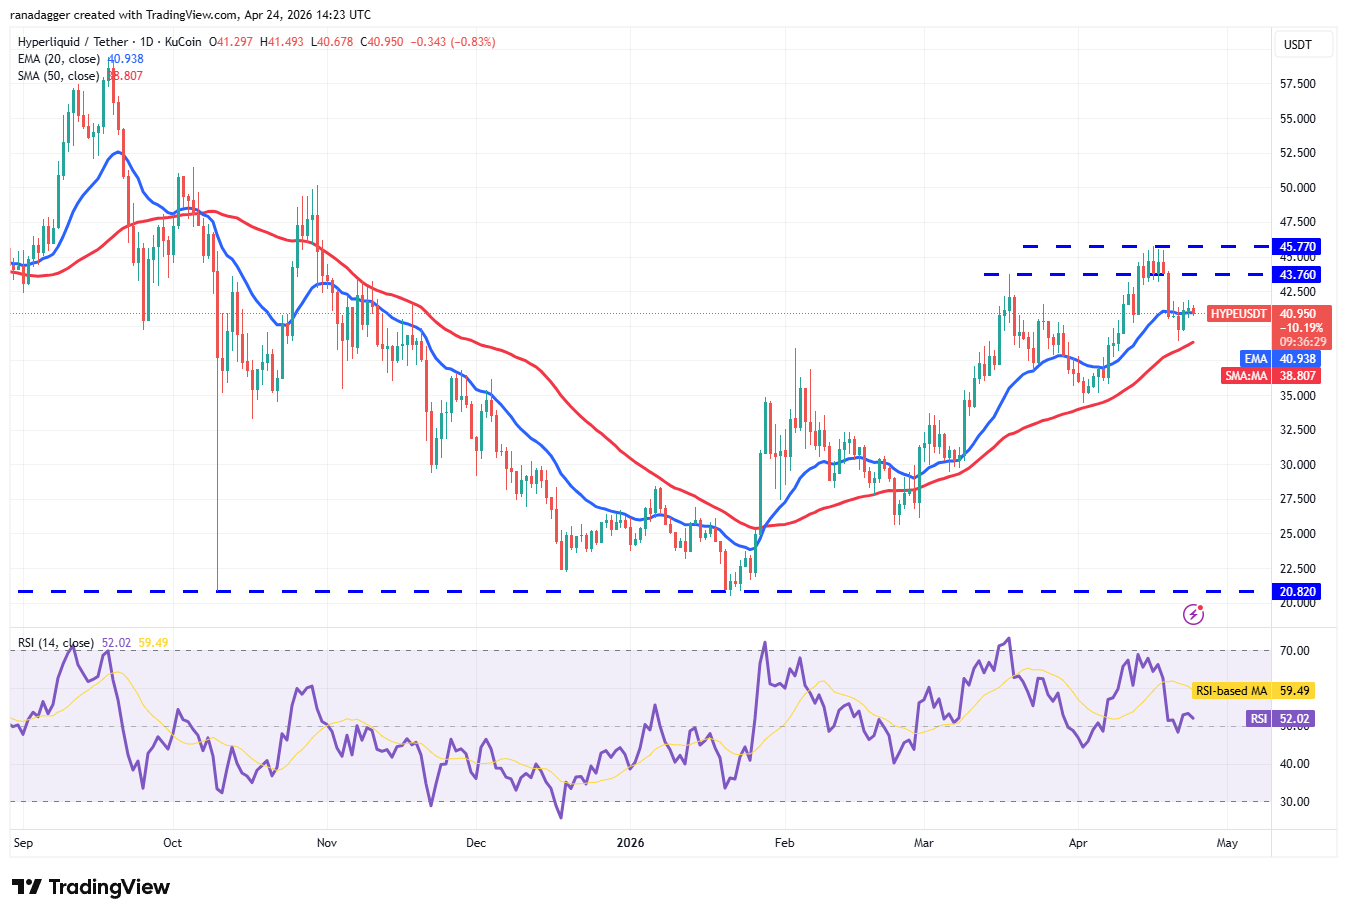
HYPE/USDT daily chart. Source: Cointelegraph/TradingView
The flattening 20-day EMA and the RSI just above the midpoint signal a balance between supply and demand. If the HYPE price rises and maintains above $42, the bulls will endeavor to clear the $45.77 hurdle. If they can pull it off, the HYPE/USDT pair may surge to $50.
This positive view will be negated in the near term if the price turns down and breaks below the 50-day SMA. The pair may then deepen its pullback to $34.45.
Related: Strategy stock beats Bitcoin after rising 25% in a month: BTC bottom in?
Cardano price prediction
Buyers tried to push Cardano (ADA) above the 50-day SMA ($0.25) on Wednesday, but the bears held their ground.
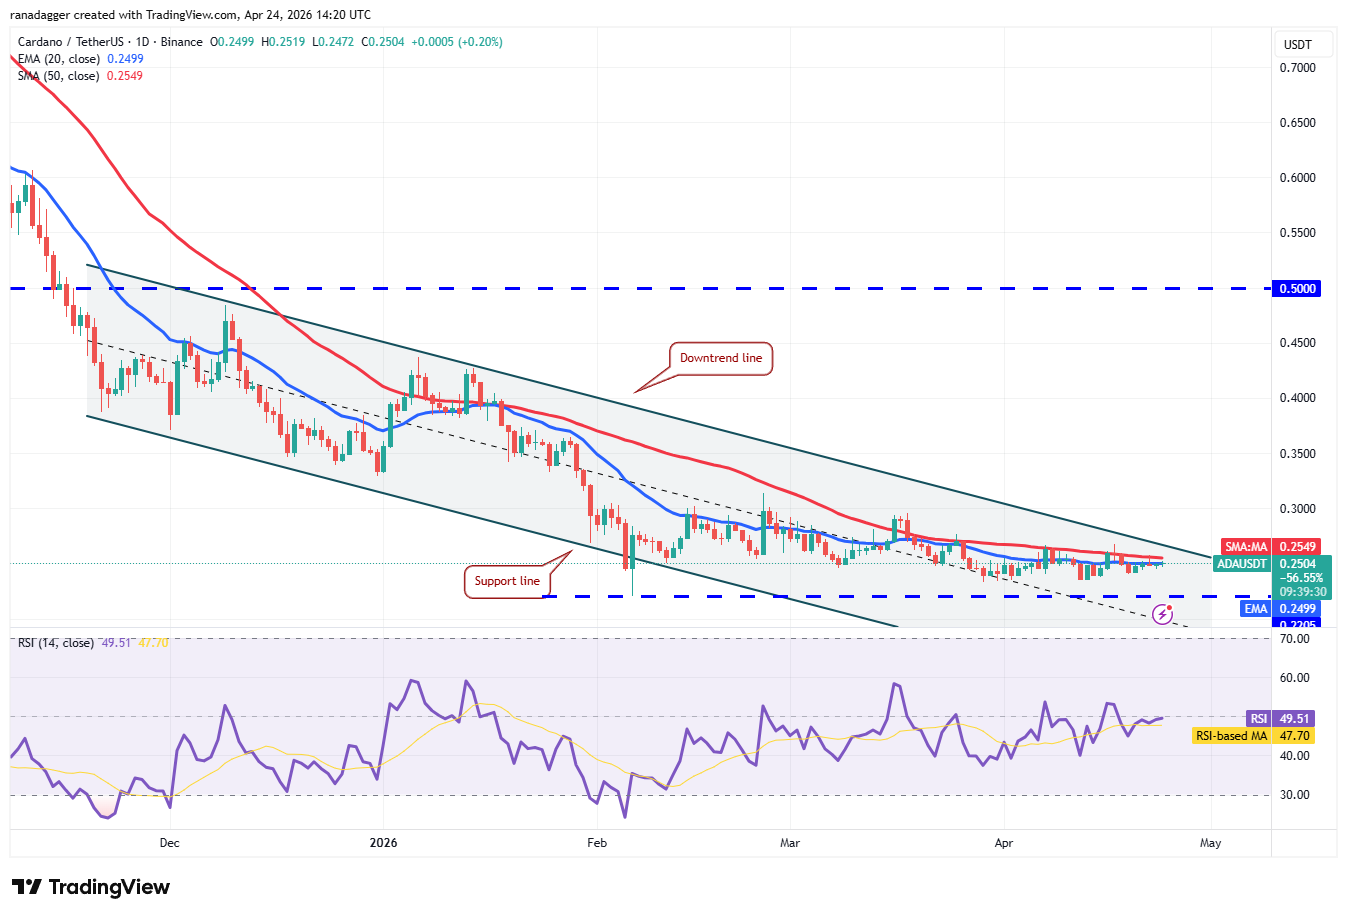
ADA/USDT daily chart. Source: Cointelegraph/TradingView
The bulls will again attempt to thrust the ADA price above the 50-day SMA and the downtrend line of the descending channel pattern. If they succeed, the ADA/USDT pair may surge to $0.32 and then to $0.37, signaling a potential trend change.
On the other hand, if the price turns sharply down from the downtrend line and breaks below the $0.22 support, it suggests the pair may remain within the channel for a few more days.
Bitcoin Cash price prediction
Bitcoin Cash (BCH) closed above the 50-day SMA ($453) on Wednesday, and the bulls successfully defended the level during the retest on Thursday and Friday.
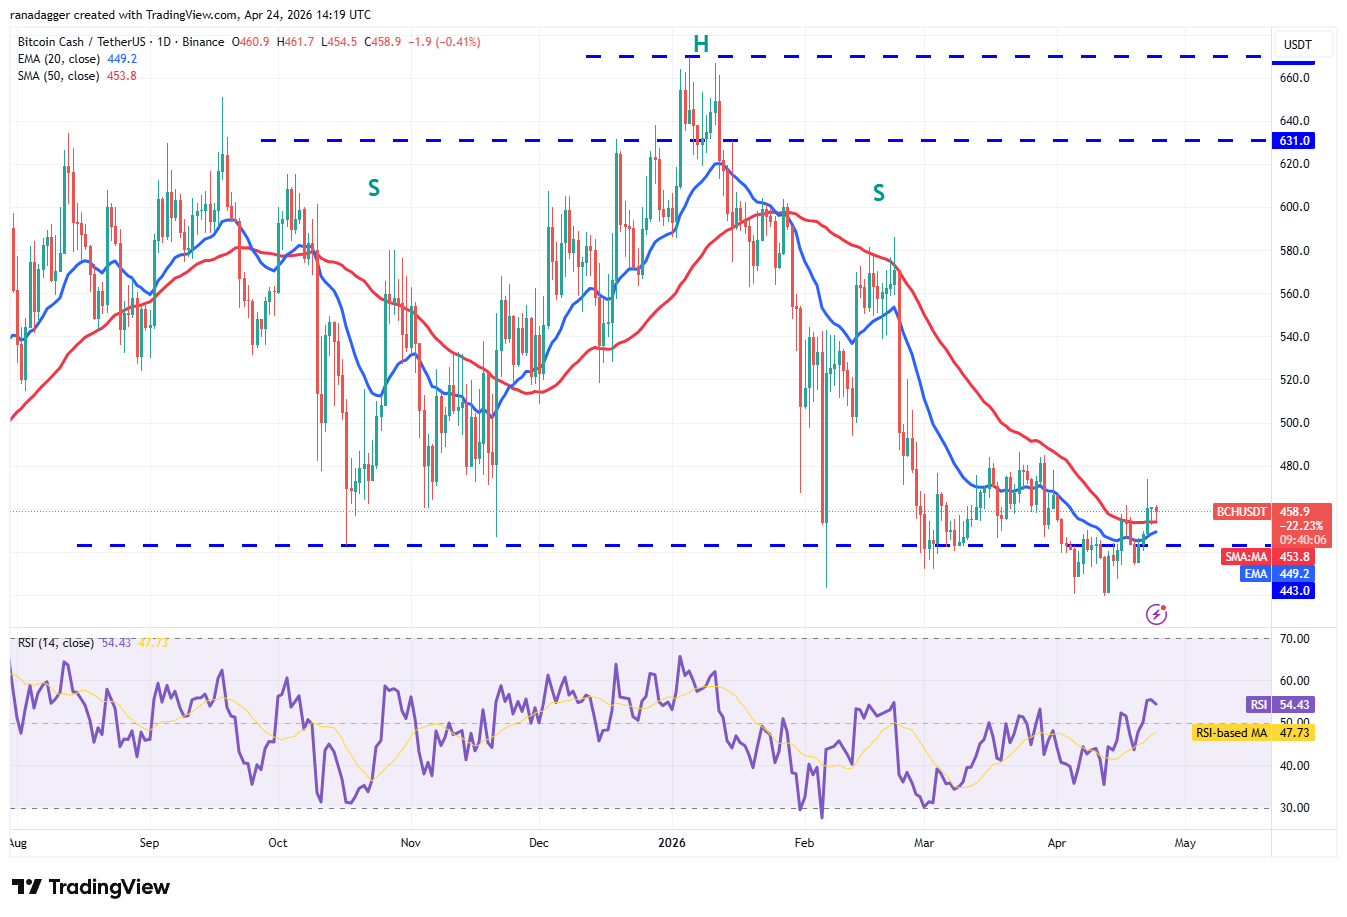
BCH/USDT daily chart. Source: Cointelegraph/TradingView
The 20-day EMA ($449) has begun to turn higher, and the RSI is just above the midpoint, indicating a slight edge for the bulls. If the BCH price turns higher from the current level and moves above $474, the next target is likely $486. Sellers are expected to vigorously defend the $486 level, as a close above it opens the door to a rally to $520.
Alternatively, if the price turns down and breaks below the moving averages, it suggests that the bears remain sellers on rallies. That may keep the BCH/USDT pair range-bound between $419 and $486.
Monero price prediction
Monero (XMR) bounced off the 20-day EMA ($353) on Thursday, indicating solid demand at lower levels.
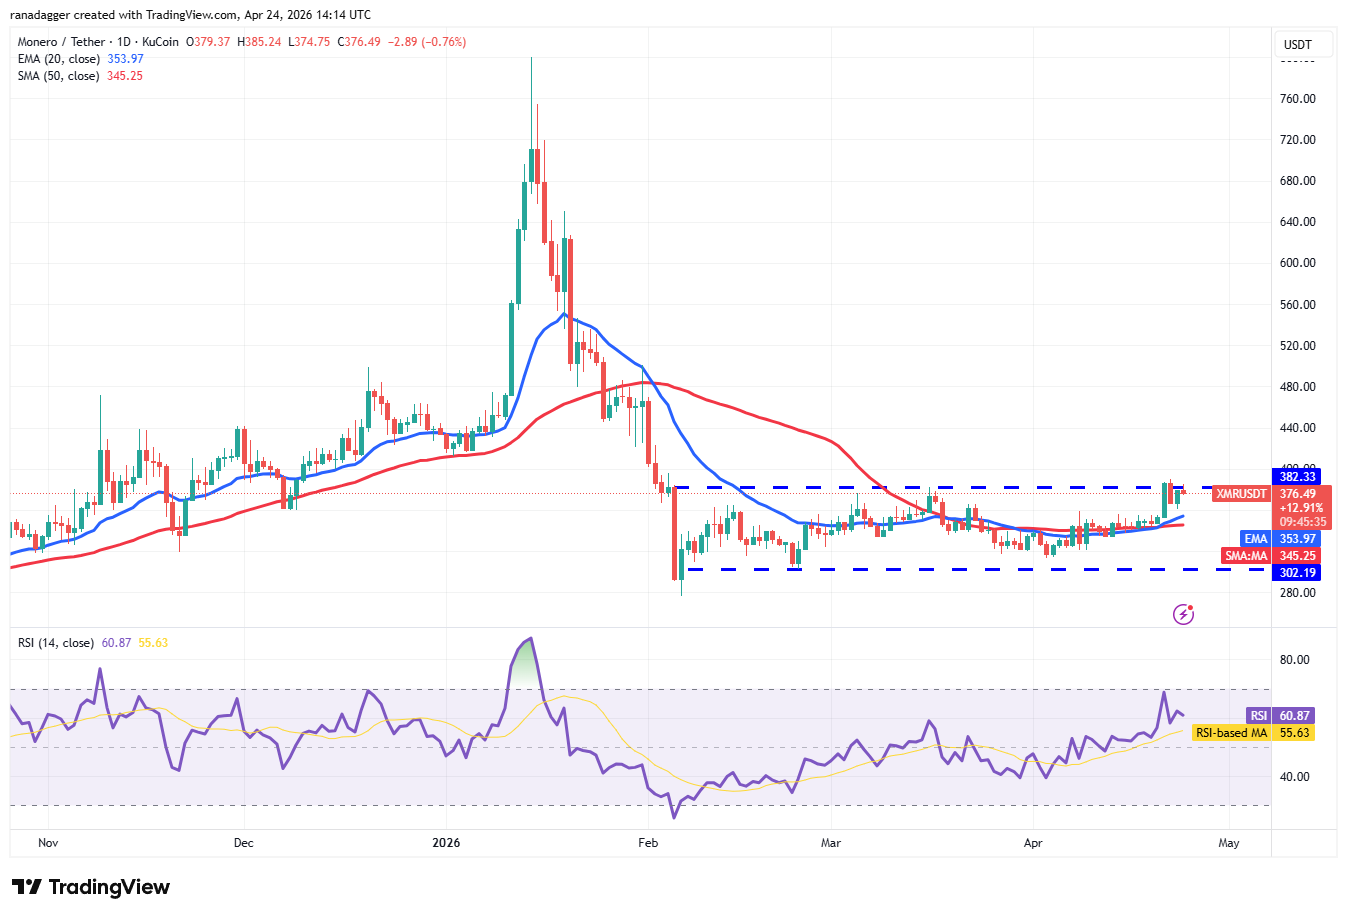
XMR/USDT daily chart. Source: Cointelegraph/TradingView
Buyers will attempt to strengthen their position by pushing the XMR price above the $382 resistance and maintaining it there. If they manage to do that, the XMR/USDT pair may rally toward the pattern target of $462.
Sellers are likely to have other plans. They will strive to defend the $382 level and pull the price back below the moving averages. If they do that, the pair may extend its stay inside the $302 to $382 range for some more time.

Subscribe to daily byte-sized crypto news from Cointelegraph
This article is produced in accordance with Cointelegraph's Editorial Policy and is intended for informational purposes only. It does not constitute investment advice or recommendations. All investments and trades carry risk; readers are encouraged to conduct independent research.
More on the subject