
Bitcoin (BTC) has risen back above the 200-day simple moving average ($83,754), indicating that the bulls are attempting a comeback. The failure of the bears to capitalize on the drop below the 200-day SMA shows that selling dries up at lower levels.
However, Bitcoin may not be out of the woods yet. Crypto analyst Matthew Hyland said in a video posted to X that Bitcoin needs a weekly close above $89,000 to confirm a bottom.
A move above $89,000 could liquidate roughly $1.60 billion in short positions, according to CoinGlass data. If that does not happen, Hyland warns that Bitcoin will fall into the $74,000 to $69,000 range.

Crypto market data daily view. Source: Coin360
Buyers have a challenging task ahead of them. The inflows of $13.3 million into US spot Bitcoin exchange-traded funds (ETFs) on March 12 could not be sustained, and the ETFs recorded outflows of $135.2 million on March 13, per Farside Investors data.
This shows that the investors remain nervous and are pressing the sell button on new tariff threats and actions by US President Donald Trump.
Could Bitcoin surge to $100,000, pulling select altcoins higher? Let’s analyze the charts of the top 10 cryptocurrencies to find out.
Bitcoin price analysis
Bitcoin bulls are trying to start a recovery but are expected to face significant resistance in the zone between the 200-day SMA and the 20-day exponential moving average ($86,717).

BTC/USDT daily chart. Source: Cointelegraph/TradingView
If buyers drive the price above the 20-day EMA, it will signal that the break below the 200-day SMA may have been a bear trap. The BTC/USDT pair could rise to the 50-day SMA ($93,876) and, after that, to the $100,000 psychological barrier.
Conversely, if the price turns down from the overhead resistance zone with force, it will indicate that the bears are in command. That increases the likelihood of a drop to the vital support at $73,777. Buyers are expected to fiercely defend the $73,777 level because a drop below it may pull the pair to $67,000.
Ether price analysis
Ether (ETH) has been trading in a tight range between $1,963 and $1,754, indicating a tough battle between the bulls and the bears.

ETH/USDT daily chart. Source: Cointelegraph/TradingView
The relative strength index (RSI) is showing early signs of forming a positive divergence. If the price rises above $1,963, the ETH/USDT pair could climb to the breakdown level of $2,111. This level may attract aggressive selling by the bears, but if the bulls persist, the pair could rally to the 50-day SMA ($2,597).
This optimistic view will be negated if the price turns down from the current level of $2,111 and breaks below $1,754. That will signal the resumption of the downtrend. The pair may then nosedive to $1,500.
XRP price analysis
XRP (XRP) rebounded off the $2 support on March 11 and reached the 20-day EMA ($2.35) on March 13.

XRP/USDT daily chart. Source: Cointelegraph/TradingView
The bears are trying to halt the recovery at the 20-day EMA, but the bulls have kept up the pressure. That increases the possibility of a break above the 20-day EMA. The XRP/USDT pair may then rise to $2.64. If this level is cleared, the pair could rally to $3.
Contrarily, if the price turns down sharply from the current level, it will suggest that the sentiment remains negative. The pair may retest the crucial $2 support, and if this level gives way, the pair will complete a bearish head-and-shoulders pattern. That may sink the pair to $1.28.
BNB price analysis
BNB (BNB) rose above the 20-day EMA ($591) on March 13, but the bulls could not sustain the higher levels, as seen from the long wick on the candlestick.

BNB/USDT daily chart. Source: Cointelegraph/TradingView
The bulls are again trying to push the price above the 20-day EMA. The BNB/USDT pair could challenge the 50-day SMA ($624) if they can pull it off. A break and close above the 50-day SMA will suggest that the correction may be over. The pair could then attempt a rally to $686.
If bears want to prevent the upside, they will have to yank the price below the $500 support. The pair may then fall to $460, which is expected to attract aggressive buying by the bulls.
Solana price analysis
Solana (SOL) has been trading above the $120 level, but the bulls have failed to push the price above $132.

SOL/USDT daily chart. Source: Cointelegraph/TradingView
If the price skids below $120, the SOL/USDT pair could drop to $110. This is a critical support to watch out for because a break and close below it may start a downward move to $98 and then to $80.
On the upside, a break and close above the 20-day EMA suggests that the selling pressure is reducing. The pair could rally to the 50-day SMA ($178), where the bears are expected to mount a strong defense.
Cardano price analysis
Cardano (ADA) was rejected from the 20-day EMA ($0.77) on March 12, signaling that the bears are selling on rallies.

ADA/USDT daily chart. Source: Cointelegraph/TradingView
The ADA/USDT pair could drop to the uptrend line, which is an important level for the bulls to defend. If the price bounces off the uptrend line with strength, it will improve the prospects of a break above the moving averages. If that happens, the pair could rise to $1.02.
This positive view will be invalidated in the near term if the price turns down and breaks below the uptrend line. That could start a slide to $0.58 and subsequently to the Feb. 3 intraday low of $0.50.
Dogecoin price analysis
Dogecoin (DOGE) bounced off the $0.14 support on March 11, indicating that the bulls are trying to defend the level.

DOGE/USDT daily chart. Source: Cointelegraph/TradingView
The relief rally is expected to face selling at the 20-day EMA ($0.19). If the price turns down sharply from $0.19, it increases the possibility of a break below $0.14. The DOGE/USDT pair could then plummet to $0.10.
Related: Bitcoin-to-gold ratio breaks 12-year support as gold price hits a record $3K
The first sign of strength will be a break and close above the 20-day EMA. That could open the doors for a rally to the 50-day SMA ($0.24). Sellers will try to stall the up move at the 50-day SMA, but if the bulls pierce the resistance, the pair could climb to $0.29.
Pi price analysis
Pi’s (PI) recovery stalled at $1.80 on March 13, indicating that the bears are selling on every minor rally.

PI/USDT daily chart. Source: Cointelegraph/TradingView
The bears will try to sink the price to $1.20, which is a crucial level to watch out for. If the price rebounds off $1.20, it will indicate a possible range formation. The PI/USDT pair could oscillate between $1.20 and $1.80 for some time.
Contrary to this assumption, if the price continues lower and breaks below $1.20, it will signal the resumption of the downward move. The pair could descend to the 78.6% retracement level of $0.72.
UNUS SED LEO price analysis
UNUS SED LEO (LEO) has been trading near the $10 overhead resistance, indicating that the bulls have kept up the pressure.
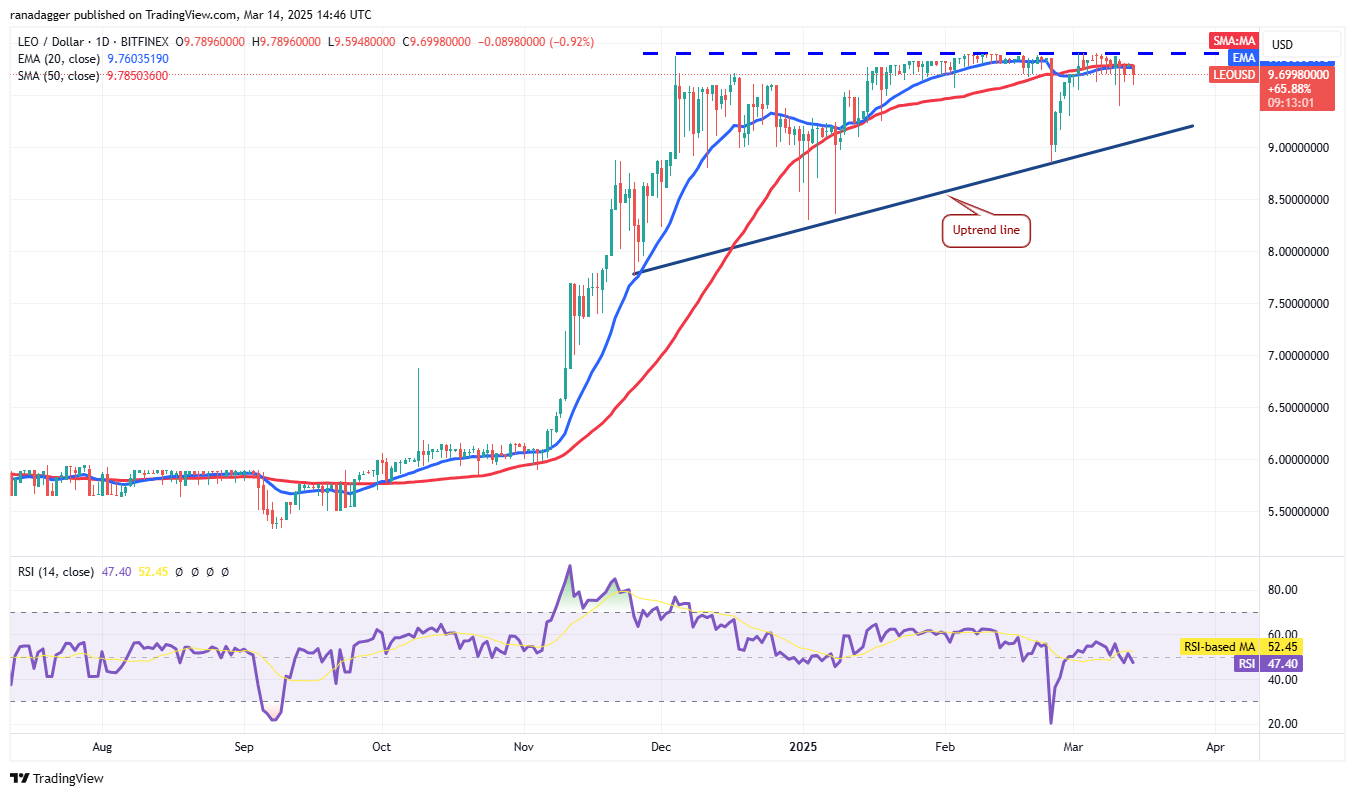
LEO/USD daily chart. Source: Cointelegraph/TradingView
A break and close above $10 will complete a bullish ascending triangle pattern, which could start an upmove toward the pattern target of $12.04.
The bears are likely to have other plans. They will try to pull the price to the uptrend line, which is an important level to watch out for. If the price rebounds off the uptrend line, it will signal that the LEO/USD pair may remain inside the triangle for a while.
The bears will gain the upper hand on a break and close below the uptrend line. That could sink the pair to $8.84 and later to $8.30.
Chainlink price analysis
Chainlink (LINK) plunged and closed below the support line of the descending channel pattern on March 10, but the bears could not sustain the lower levels.

LINK/USDT daily chart. Source: Cointelegraph/TradingView
The bulls have pushed the price back into the channel on March 14, but their efforts are likely to be met with strong selling at the 20-day EMA ($15.14). If the price turns down from the 20-day EMA, the bears will attempt to sink the LINK/USDT pair below $11.85. If they manage to do that, the pair could decline to $10.
On the contrary, a break and close above the 20-day EMA will signal that the markets have rejected the break below the channel. The pair may then climb to the 50-day SMA ($18.27).
This article does not contain investment advice or recommendations. Every investment and trading move involves risk, and readers should conduct their own research when making a decision.
This article does not contain investment advice or recommendations. Every investment and trading move involves risk, and readers should conduct their own research when making a decision. While we strive to provide accurate and timely information, Cointelegraph does not guarantee the accuracy, completeness, or reliability of any information in this article. This article may contain forward-looking statements that are subject to risks and uncertainties. Cointelegraph will not be liable for any loss or damage arising from your reliance on this information.
