
Price predictions 6/1: SPX, DXY, BTC, ETH, BNB, XRP, SOL, HYPE, DOGE, ZEC
MarketsPublishedJun 1, 2026
Strategy’s first Bitcoin sale in years added to investors’ negative sentiment, sending BTC below $71,000 and ETH toward fresh lows.

Key points:
- Bitcoin dropped to a crucial support level where buyers are expected to step in; if they fail, the next stop may be $65,000.
- Select major altcoins have slipped to critical support levels as crypto markets continue to fall far behind stock markets.
Bitcoin (BTC) dropped under $71,000 on reports that Strategy sold 32 BTC last week at an average price of $77,135 per BTC. This was Strategy's first reported BTC sale since a 2022 tax-loss transaction. The quantity sold is minuscule compared with Strategy’s total holding of 843,706 BTC, but it has hurt short-term investor sentiment.
BTC’s weakness follows $2.96 billion in outflows from US spot BTC exchange-traded funds since May 15, according to Farside Investors data. Santiment said in a recent report that the large amount of money leaving BTC ETFs in a short period shows “peak fear, frustration, or risk aversion” among investors. The crypto analytics firm added that the massive outflows may be a sign that a bottom may be near.
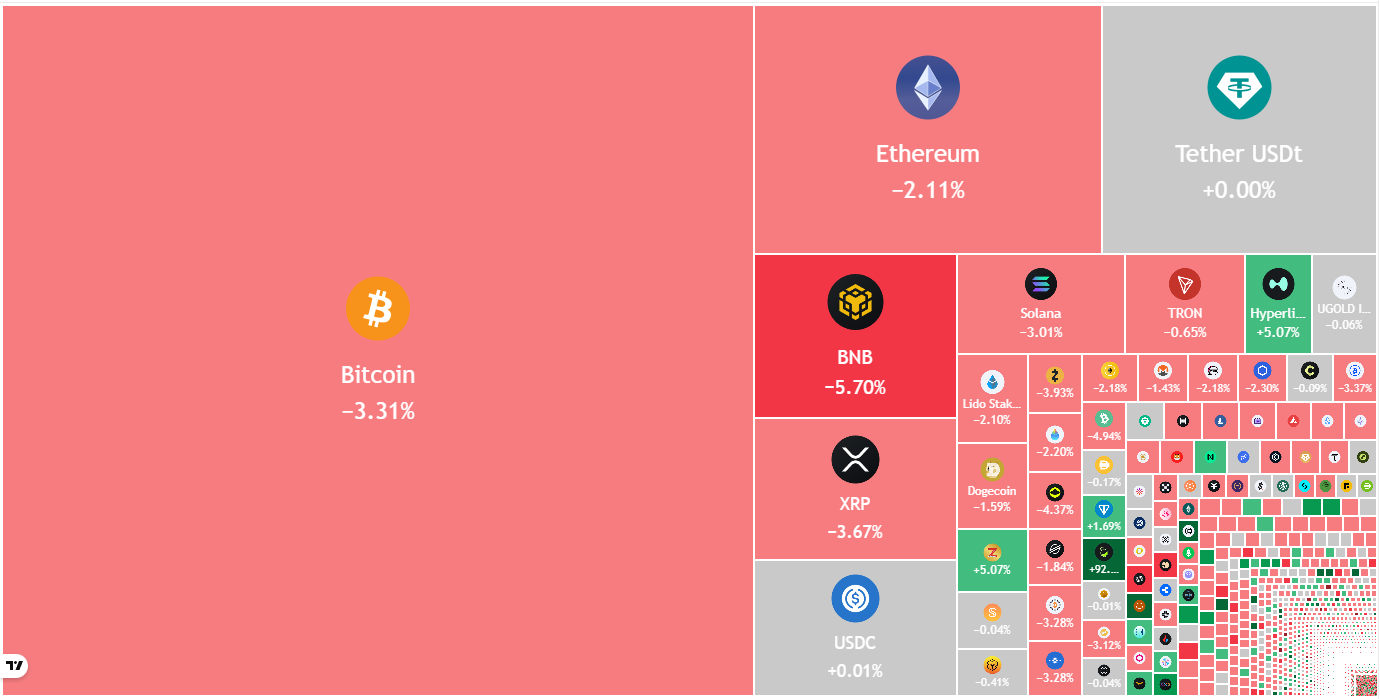
Crypto market data daily view. Source: TradingView
While some analysts anticipate BTC to hit a new cycle low below $60,000, economist Timothy Peterson said in a post on X that BTC may “grind higher over the summer, by a few percentage points, topping out in the last week of July.
Could BTC and the major altcoins break below their support levels? Let’s analyze the charts of the top 10 cryptocurrencies to find out.
S&P 500 Index price prediction
The S&P 500 Index (SPX) is trading just under the new all-time high of 7,599 hit on Friday, indicating that bullish momentum remains intact.
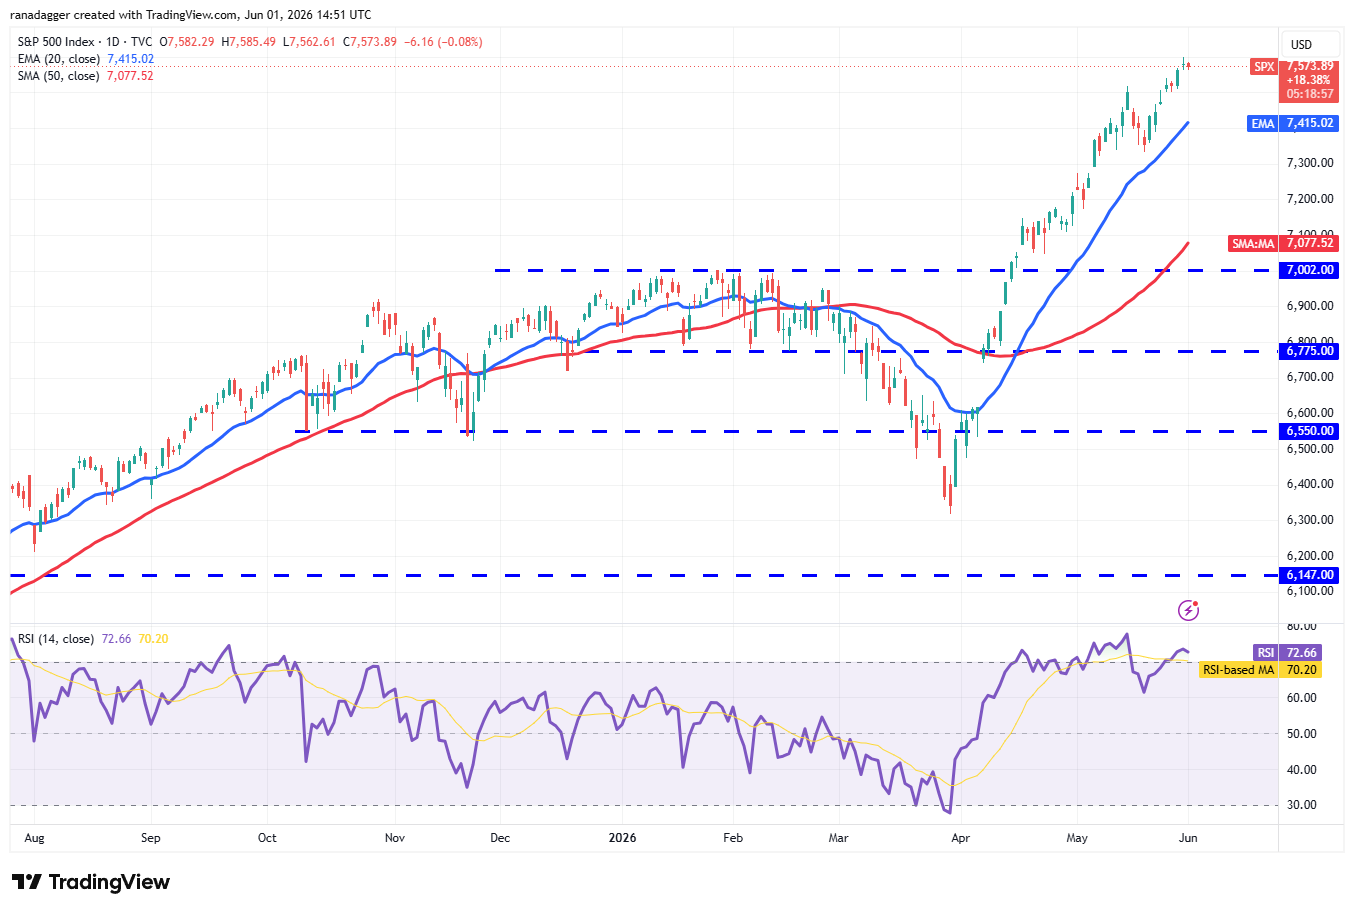
SPX daily chart. Source: Cointelegraph/TradingView
The relative strength index (RSI) has risen into the overbought zone, but that in itself is not a sign of a market reversal. If the price remains above the 20-day exponential moving average (7,415), the possibility of a rally to 8,000 increases.
This positive view will be invalidated in the near term if the price turns down sharply and closes below the 20-day EMA. That suggests profit-booking by short-term traders. The index may then plunge to the 7,000 level, which is likely to act as strong support.
US Dollar Index price prediction
Buyers pushed the US Dollar Index (DXY) above 99.51 on Thursday, but couldn’t sustain the higher levels.
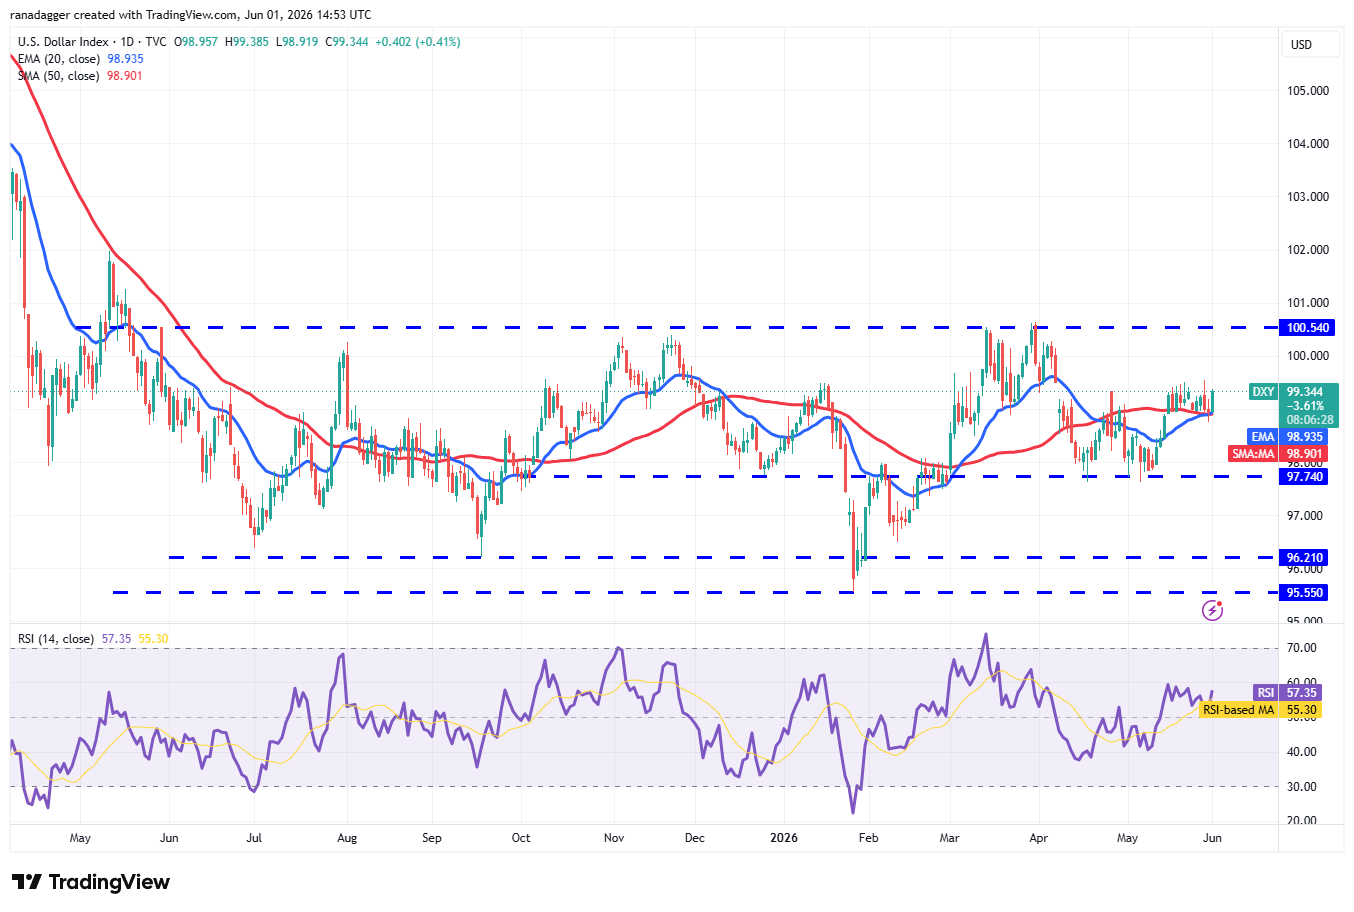
DXY daily chart. Source: Cointelegraph/TradingView
The flattening of moving averages and the RSI just above the midpoint do not give a clear advantage to either the bulls or the bears.
If the price rises above 99.55, the index may reach the overhead resistance at 100.54. Sellers are expected to fiercely defend the 100.54 level, as a break above it would signal the start of a new uptrend toward the 102 level.
On the downside, a close below the moving averages opens the door to a drop to 97.74.
Bitcoin price prediction
BTC continued its downward march, reaching the support line, which is a critical level for the bulls to defend.
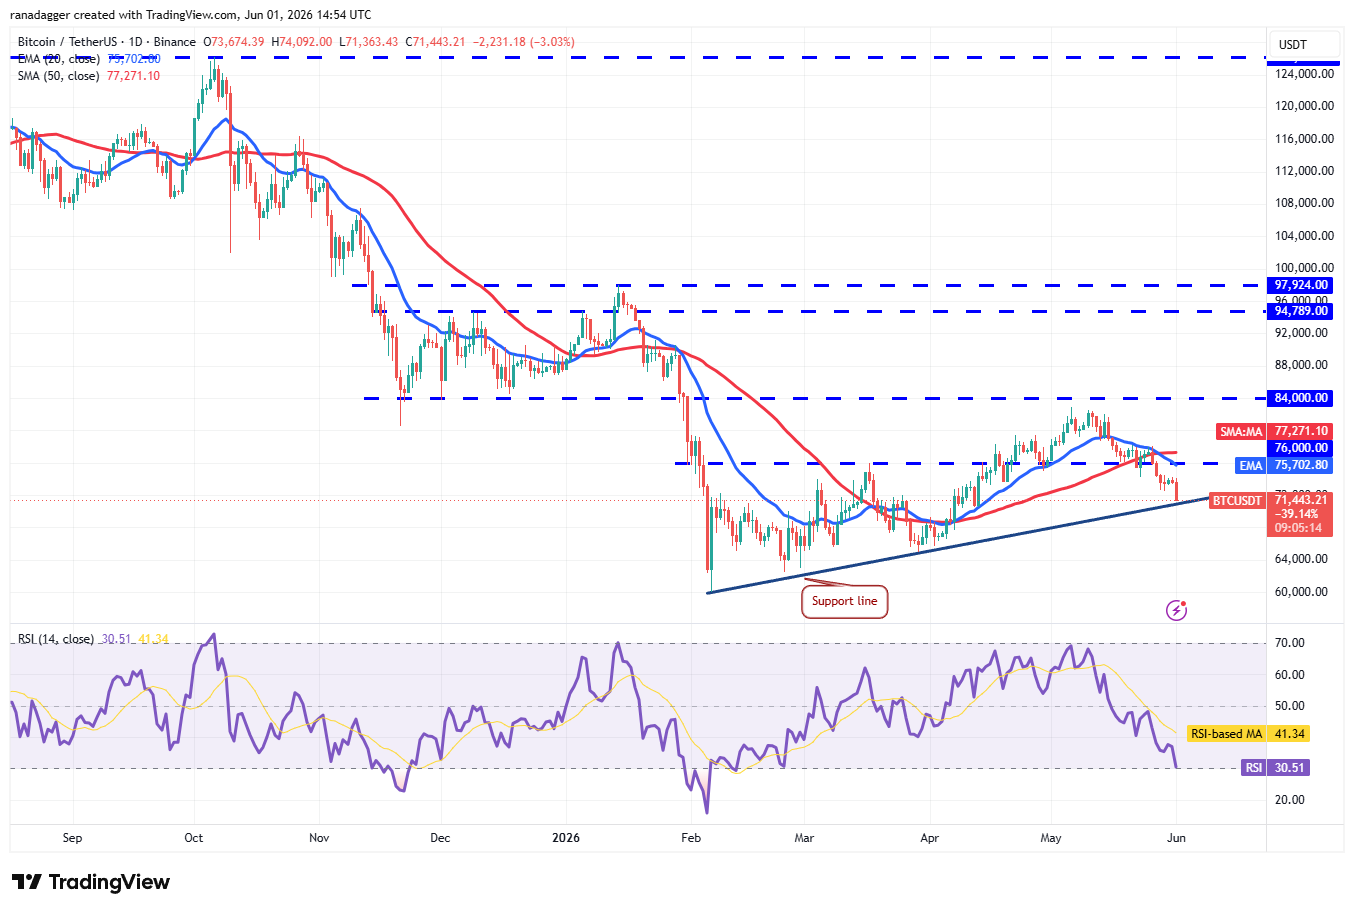
BTC/USDT daily chart. Source: Cointelegraph/TradingView
If the BTC price bounces off the support line, the bears will attempt to halt the relief rally at the 20-day EMA ($75,702). If the price turns down from the moving averages, it increases the risk of a break below the support line. The BTC/USDT pair may then tumble to $65,000 and subsequently to $60,000.
Buyers will have to push the BTC price above the 50-day simple moving average ($77,310) to signal strength. If they do that, the BTC/USDT pair may retest the crucial $84,000 overhead resistance.
Ether price prediction
Ether (ETH) has been gradually sliding toward the $1,916 support, indicating that the bears remain in control.
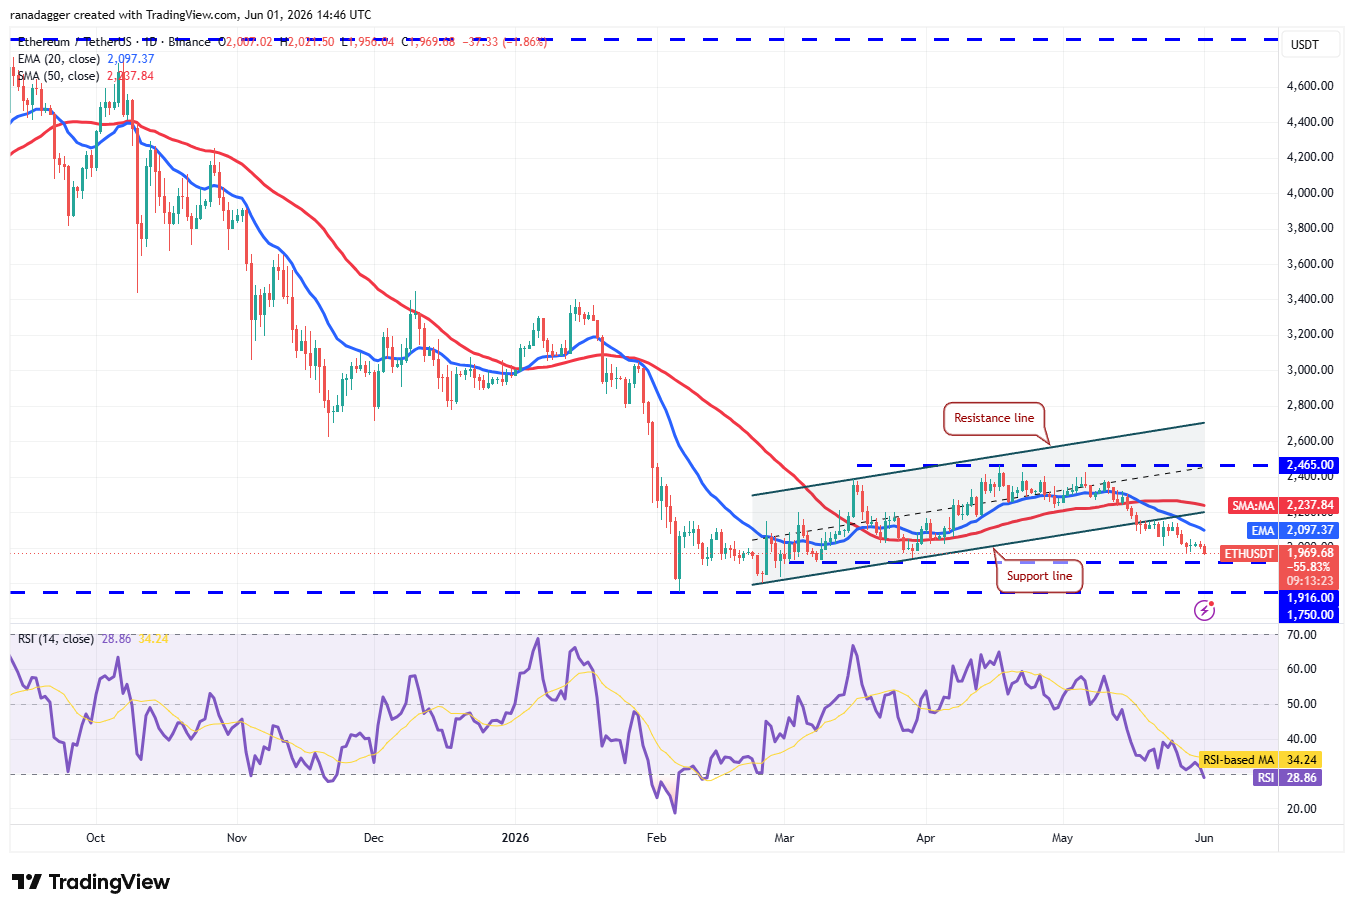
ETH/USDT daily chart. Source: Cointelegraph/TradingView
The bulls will attempt to start a rebound off the $1,916 level, but the relief rally is expected to encounter selling at the 20-day EMA ($2,097). If the ETH price turns down sharply from the 20-day EMA, it increases the risk of a break below the $1,916 support. The ETH/USDT pair may then slump to $1,750.
Buyers will need to swiftly push the price above the moving averages to keep the pair within the $1,916 to $2,465 range for a few days.
BNB price prediction
BNB’s (BNB) range-bound action between $570 and $687 resolved in favor of the bulls on Saturday.
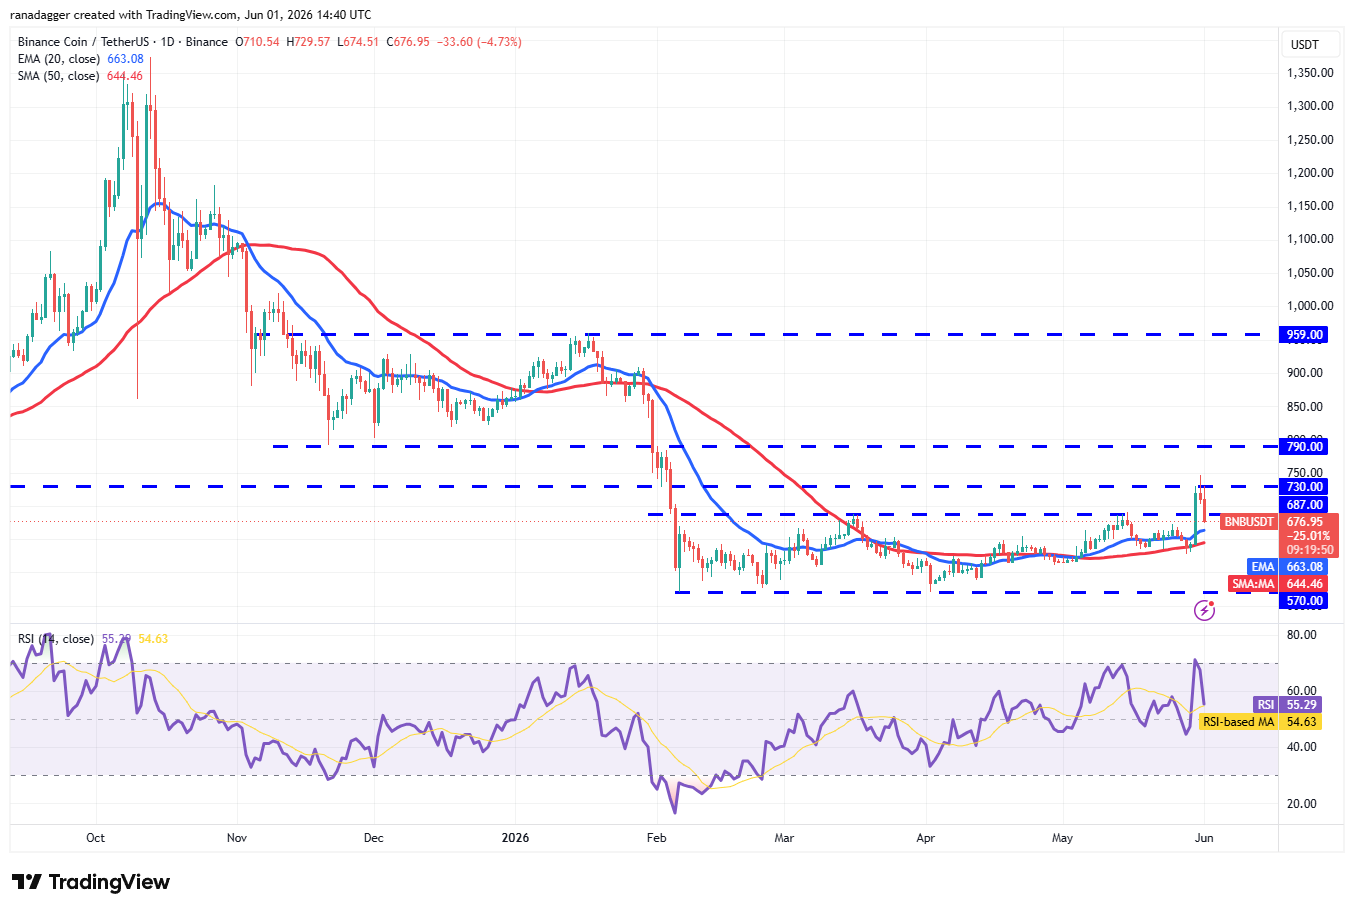
BNB/USDT daily chart. Source: Cointelegraph/TradingView
BNB price rose to $745 on Sunday, where profit-booking set in. The BNB/USDT pair has pulled back below the breakout level of $687, indicating that traders are rushing for the exits. If the price continues lower and breaks below the moving averages, it suggests that the breakout above $687 may have been a bull trap. The pair may then collapse to $570.
Buyers will have to fiercely defend the moving averages and push the price back above $745 to gain the upper hand. The pair may then rally to $790 and later to $900.
XRP price prediction
XRP (XRP) turned down from the 20-day EMA ($1.35) on Saturday, signaling that the bears continue to sell on minor relief rallies.
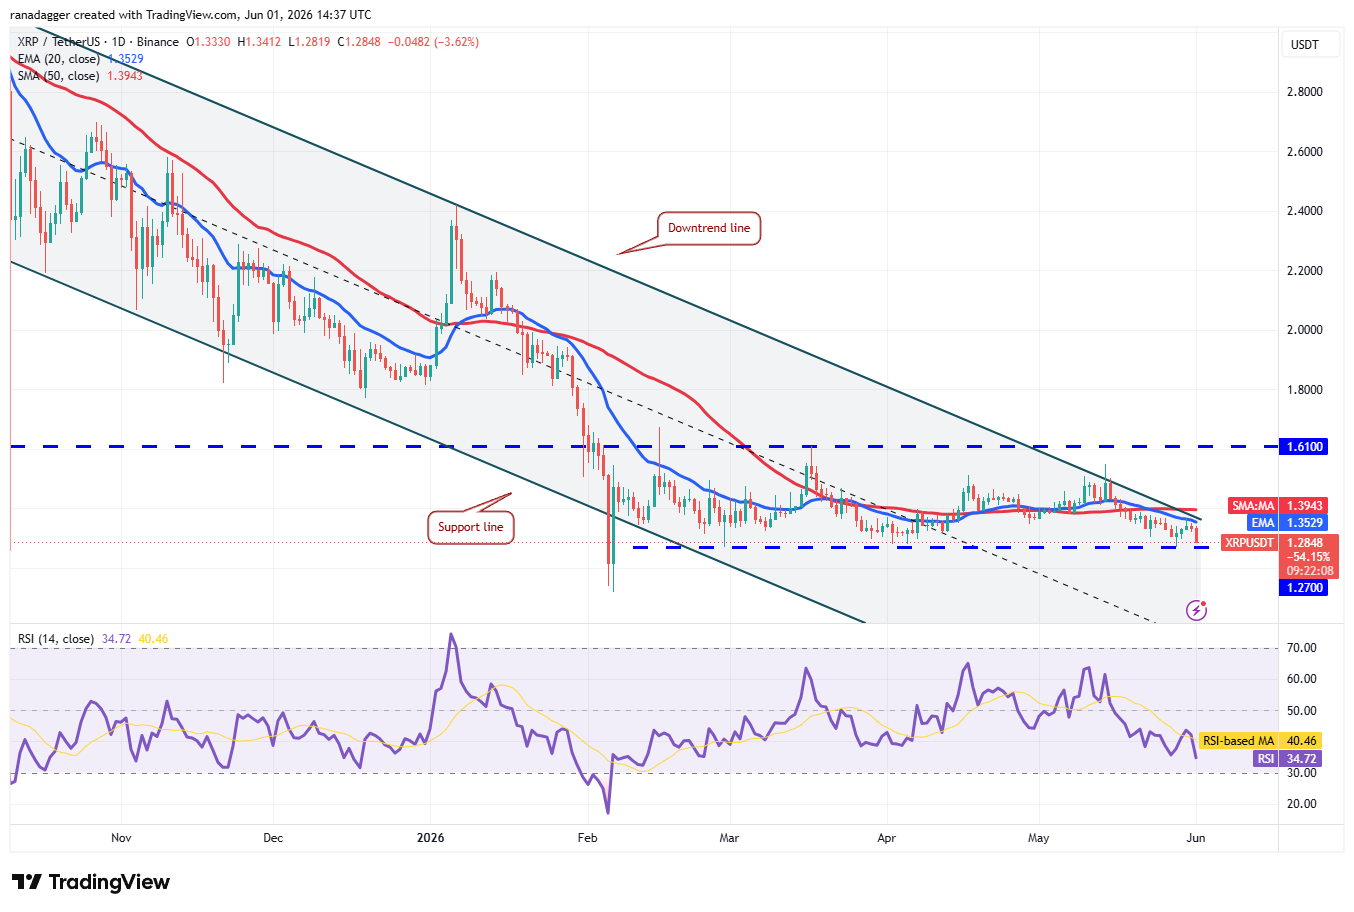
XRP/USDT daily chart. Source: Cointelegraph/TradingView
The bears will attempt to yank the XRP price below the $1.27 level. If they can pull it off, the XRP/USDT pair may retest the Feb. 6 low of $1.11 and eventually the psychological support at $1.
The first sign of strength will be a break and close above the 50-day SMA ($1.39). That suggests buying at lower levels. The pair may then ascend to the $1.61 level, where the bears are expected to step in.
Solana price prediction
Solana (SOL) failed to sustain above $82.65, indicating that the bears flipped the level into resistance.
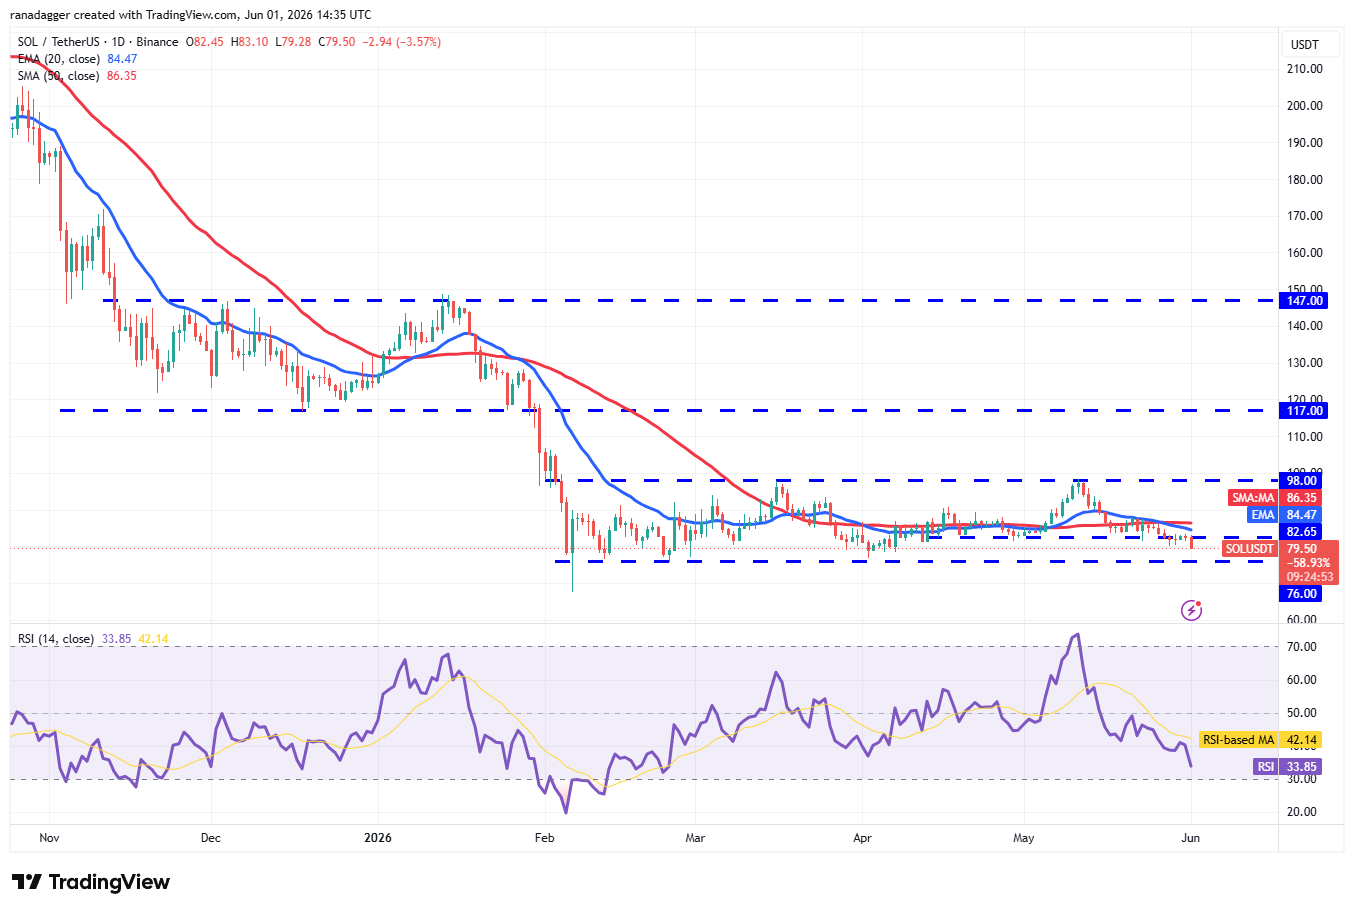
SOL/USDT daily chart. Source: Cointelegraph/TradingView
The SOL/USDT pair may plummet to $76, a level likely to attract buyers. If the price bounces off the $76 support but turns down from the 20-day EMA, it increases the likelihood of a drop to $67.
Contrary to this assumption, if the SOL price rises and breaks above the moving averages, it suggests the pair may remain within the $76 to $98 range for a while longer.
Related: Hyperliquid's HYPE breakout puts $100 price target in play
Hyperliquid price prediction
Hyperliquid (HYPE) continued its northward march toward the $77 level, indicating solid demand from the bulls.
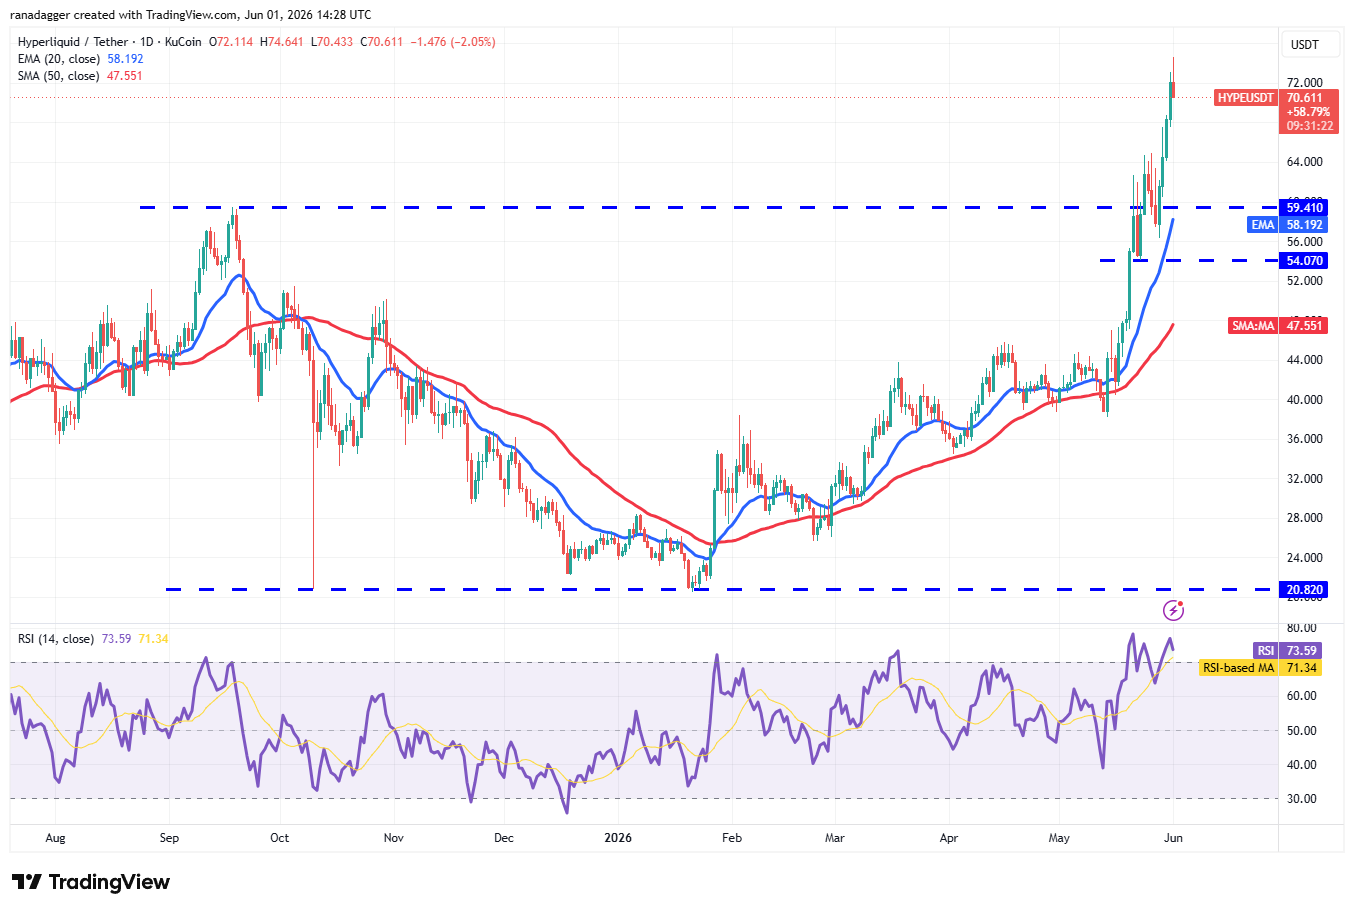
HYPE/USDT daily chart. Source: Cointelegraph/TradingView
The sharp up move has pushed the RSI into the overbought territory, signaling a possible consolidation or correction in the near term. The first support on the downside is at $64, and then the 20-day EMA ($58). Sellers will have to push the HYPE price below $54 to seize control.
The $77 level may act as a hurdle, but if bulls prevent the price from dipping below $64, the rally may continue. A close above $77 clears the path for a rally to the $85 to $89 zone.
Dogecoin price prediction
Buyers have failed to push Dogecoin (DOGE) above the moving averages, indicating a lack of demand at higher levels.
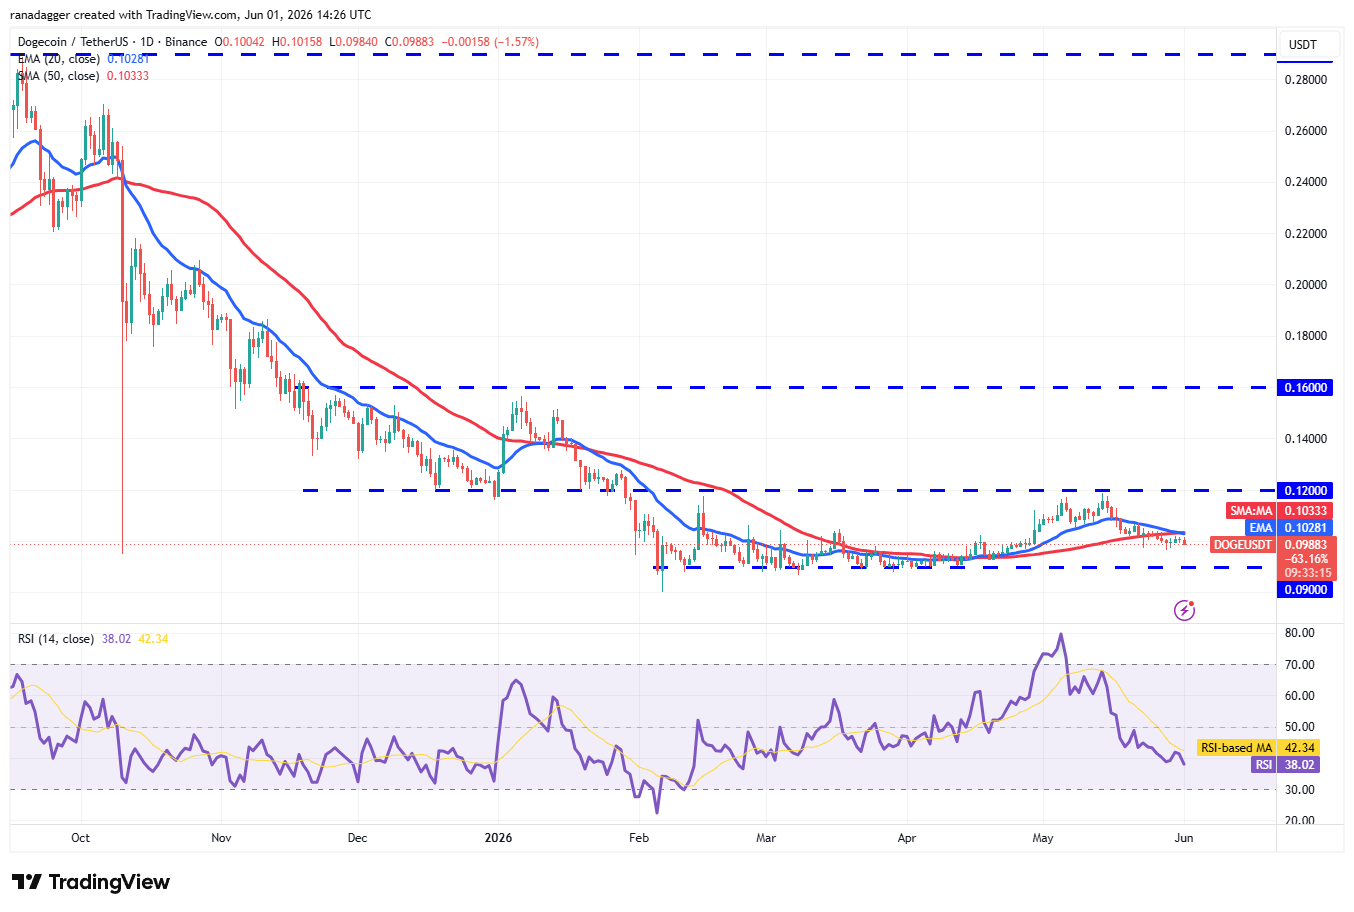
DOGE/USDT daily chart. Source: Cointelegraph/TradingView
The bears will attempt to pull the DOGE price down to the $0.09 support level. Buyers are expected to vigorously defend the $0.09 level, as a close below it may sink the DOGE/USDT pair to the Feb. 6 low of $0.08.
On the contrary, if the price rises from the current level or the $0.09 support and breaks above the moving averages, it suggests that the pair may remain within the $0.09 to $0.12 range for some time.
Zcash price prediction
Zcash (ZEC) closed above the 20-day EMA ($558) on Sunday, but the bulls could not sustain the higher levels.
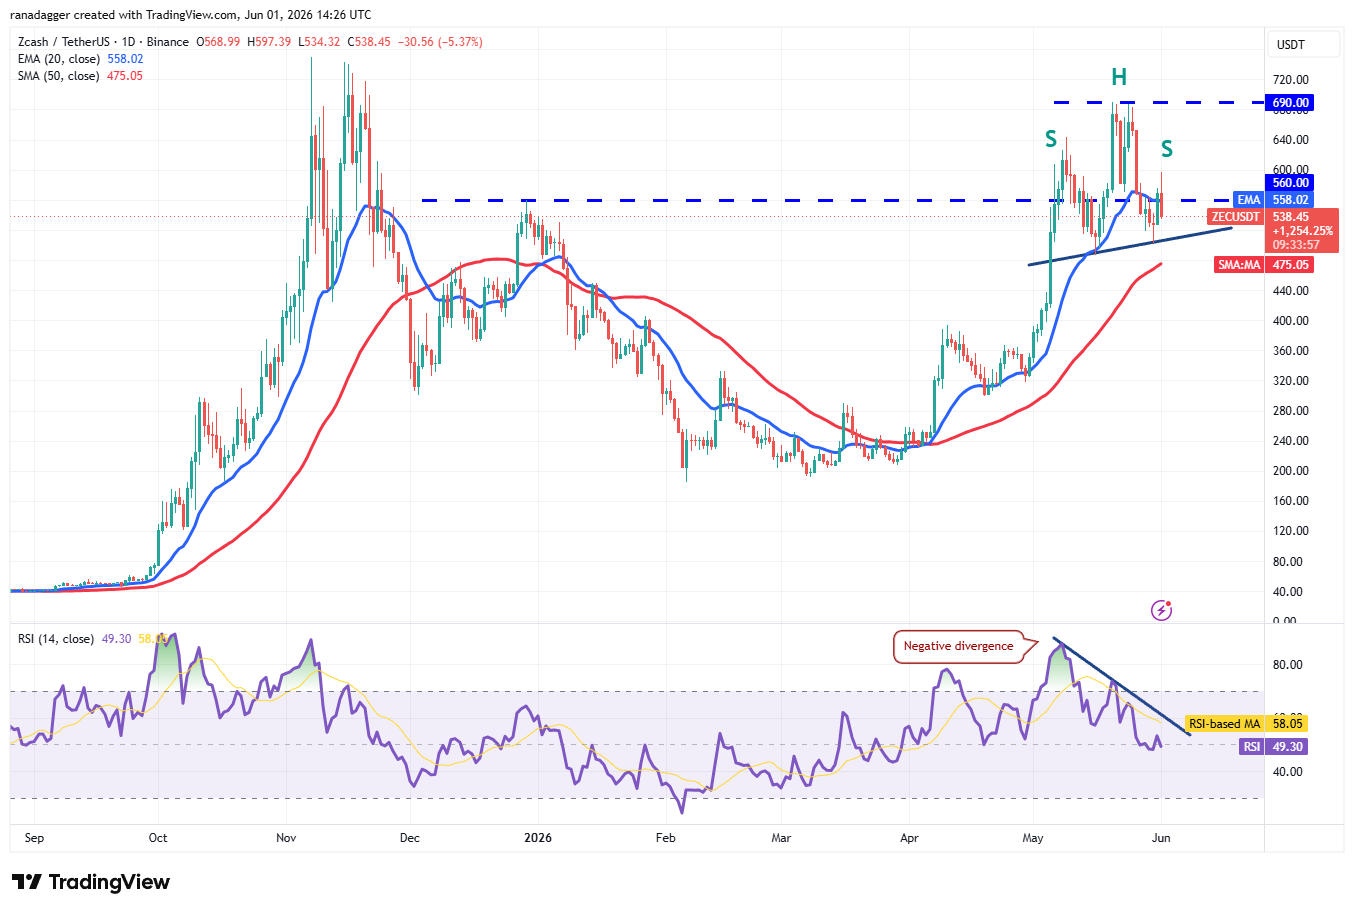
ZEC/USDT daily chart. Source: Cointelegraph/TradingView
The bears will attempt to strengthen their position by pulling the ZEC price below the 50-day SMA ($475). If they do that, the ZEC/USDT pair will complete a bearish head-and-shoulders pattern. The pair may then plunge to $400.
Contrary to this assumption, if the price turns up sharply from the 50-day SMA and rises above the 20-day EMA, it suggests buying at lower levels. That may keep the pair range-bound between $475 and $690 for a few days.

Subscribe to daily byte-sized crypto news from Cointelegraph
This article is produced in accordance with Cointelegraph's Editorial Policy and is intended for informational purposes only. It does not constitute investment advice or recommendations. All investments and trades carry risk; readers are encouraged to conduct independent research.
More on the subject